Documentation Index
Fetch the complete documentation index at: https://docs.garnet.ai/llms.txt
Use this file to discover all available pages before exploring further.
Filtering
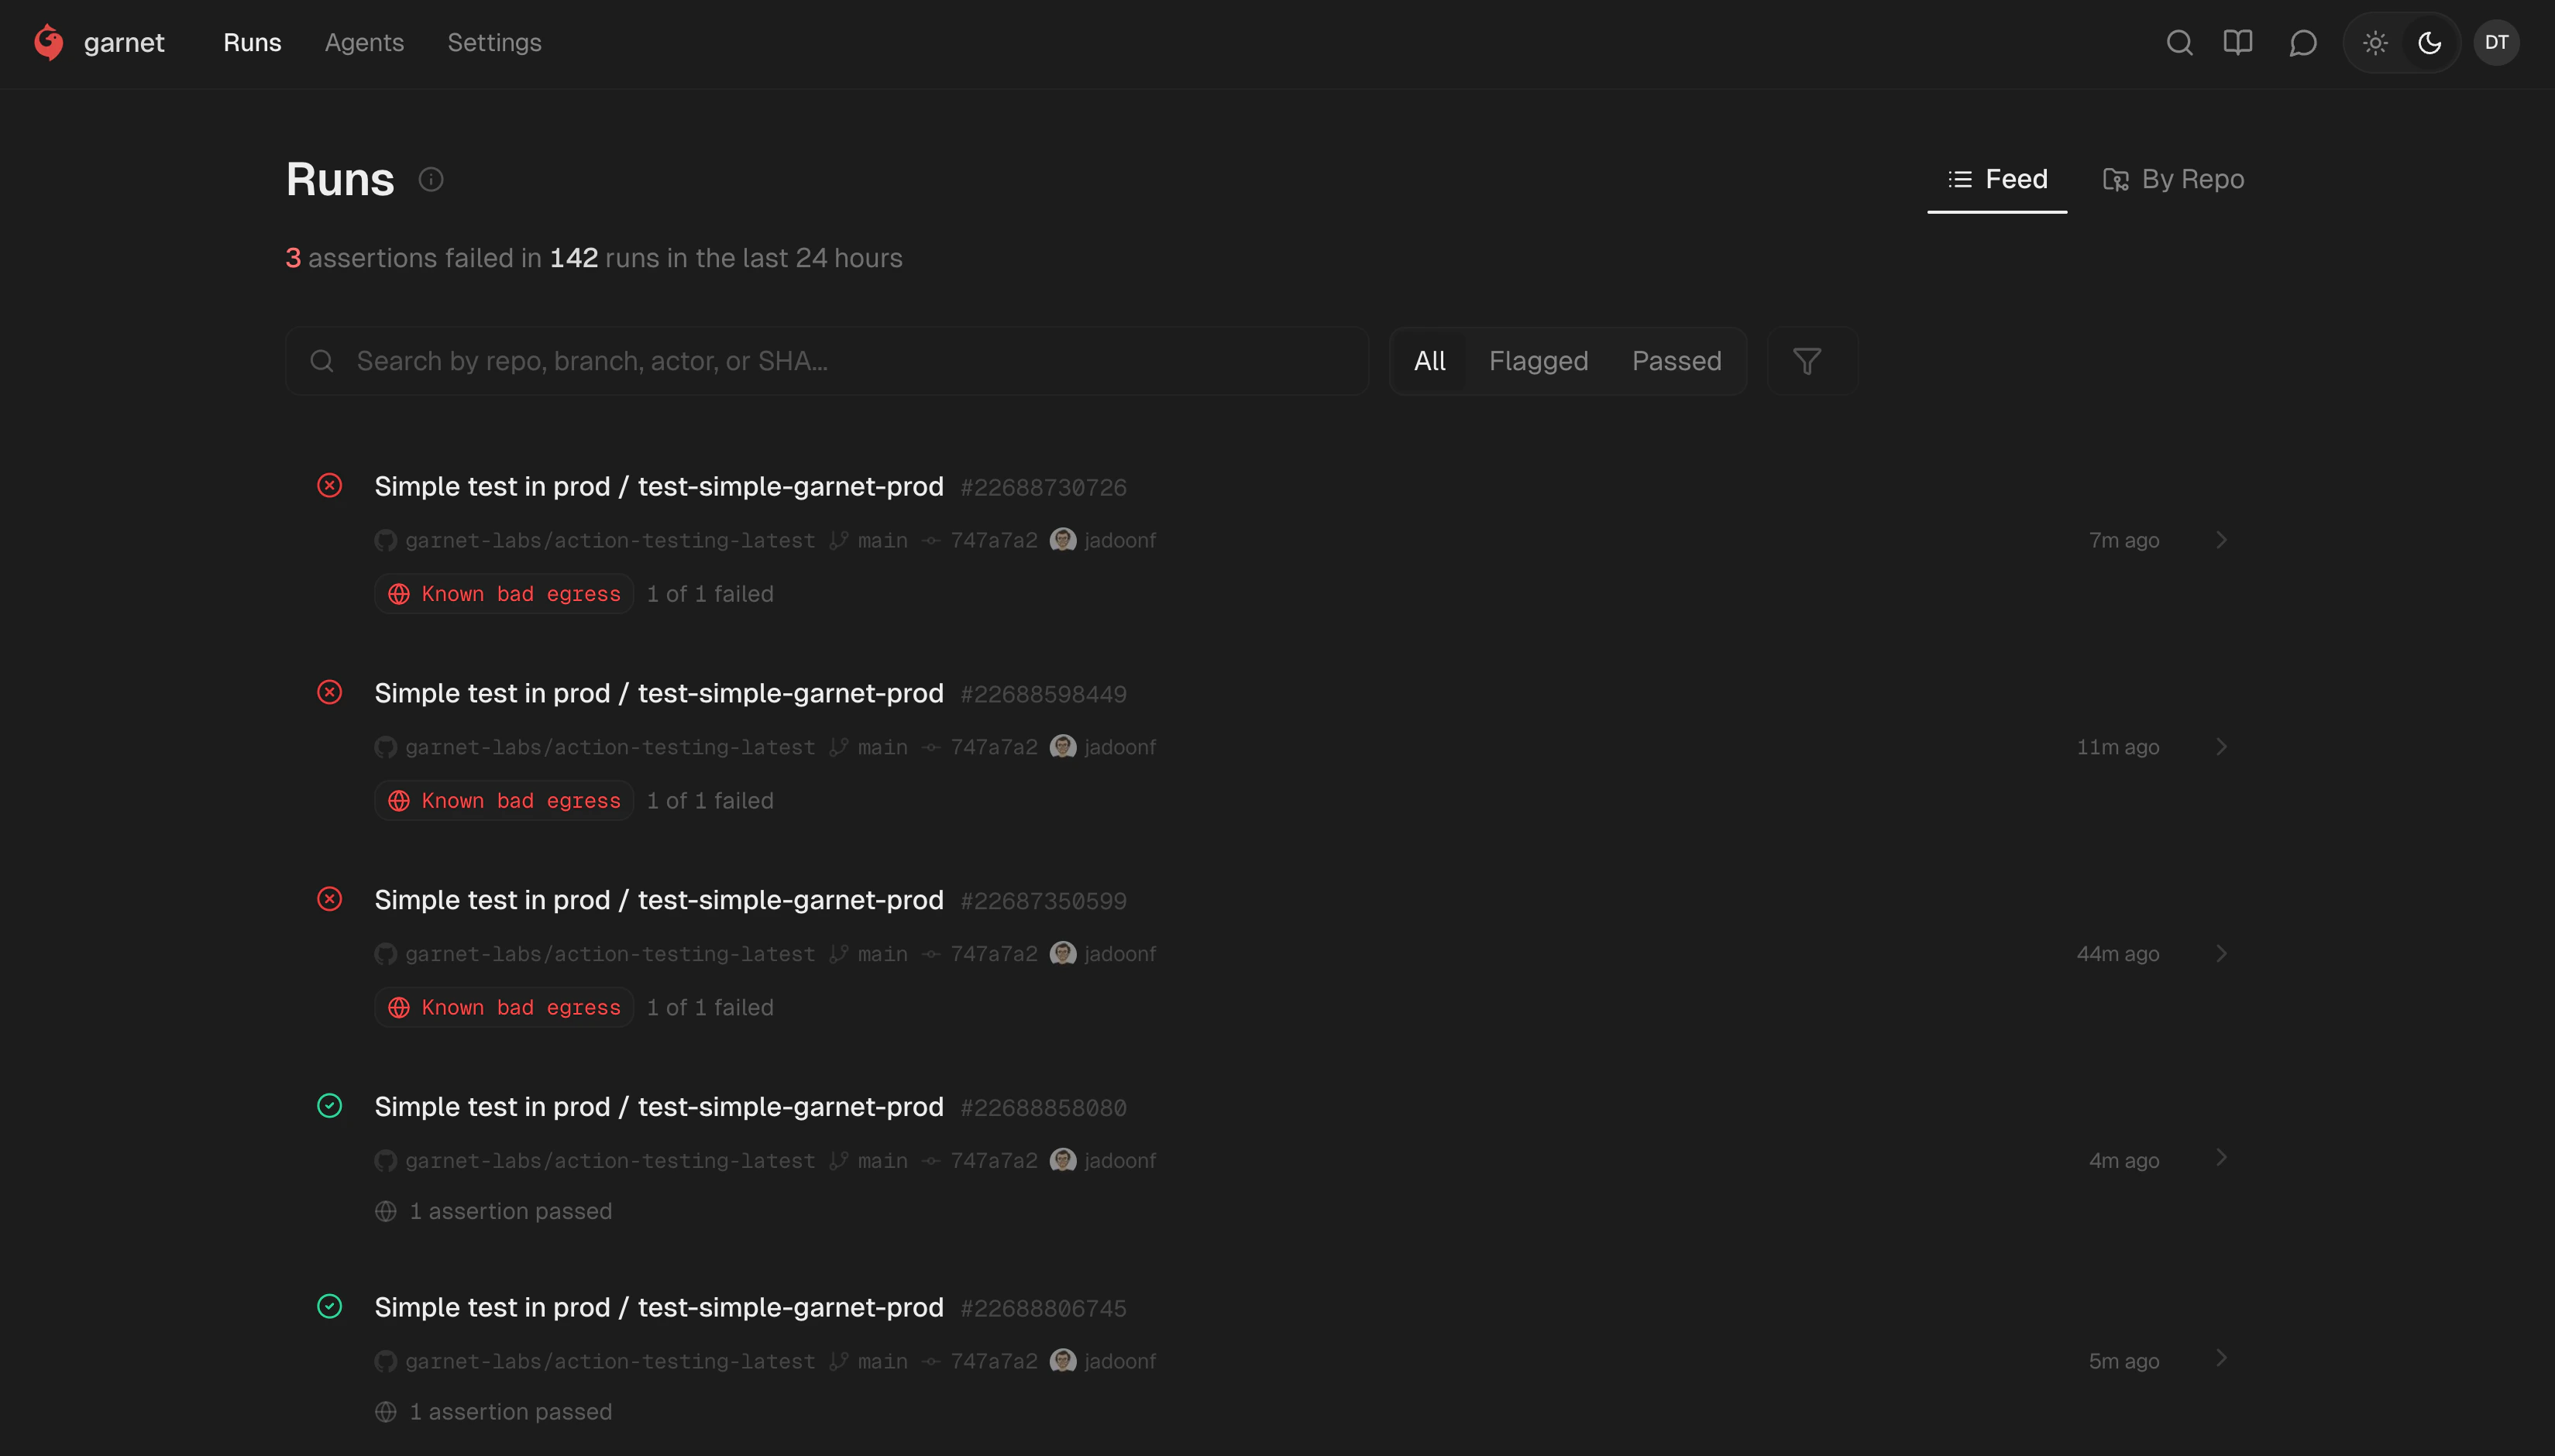
Banner shows aggregate stats. Tabs: All, Flagged, Passed. Toggle Feed vs By Repo. Search by repo, branch, actor, or SHA.Run details — passed
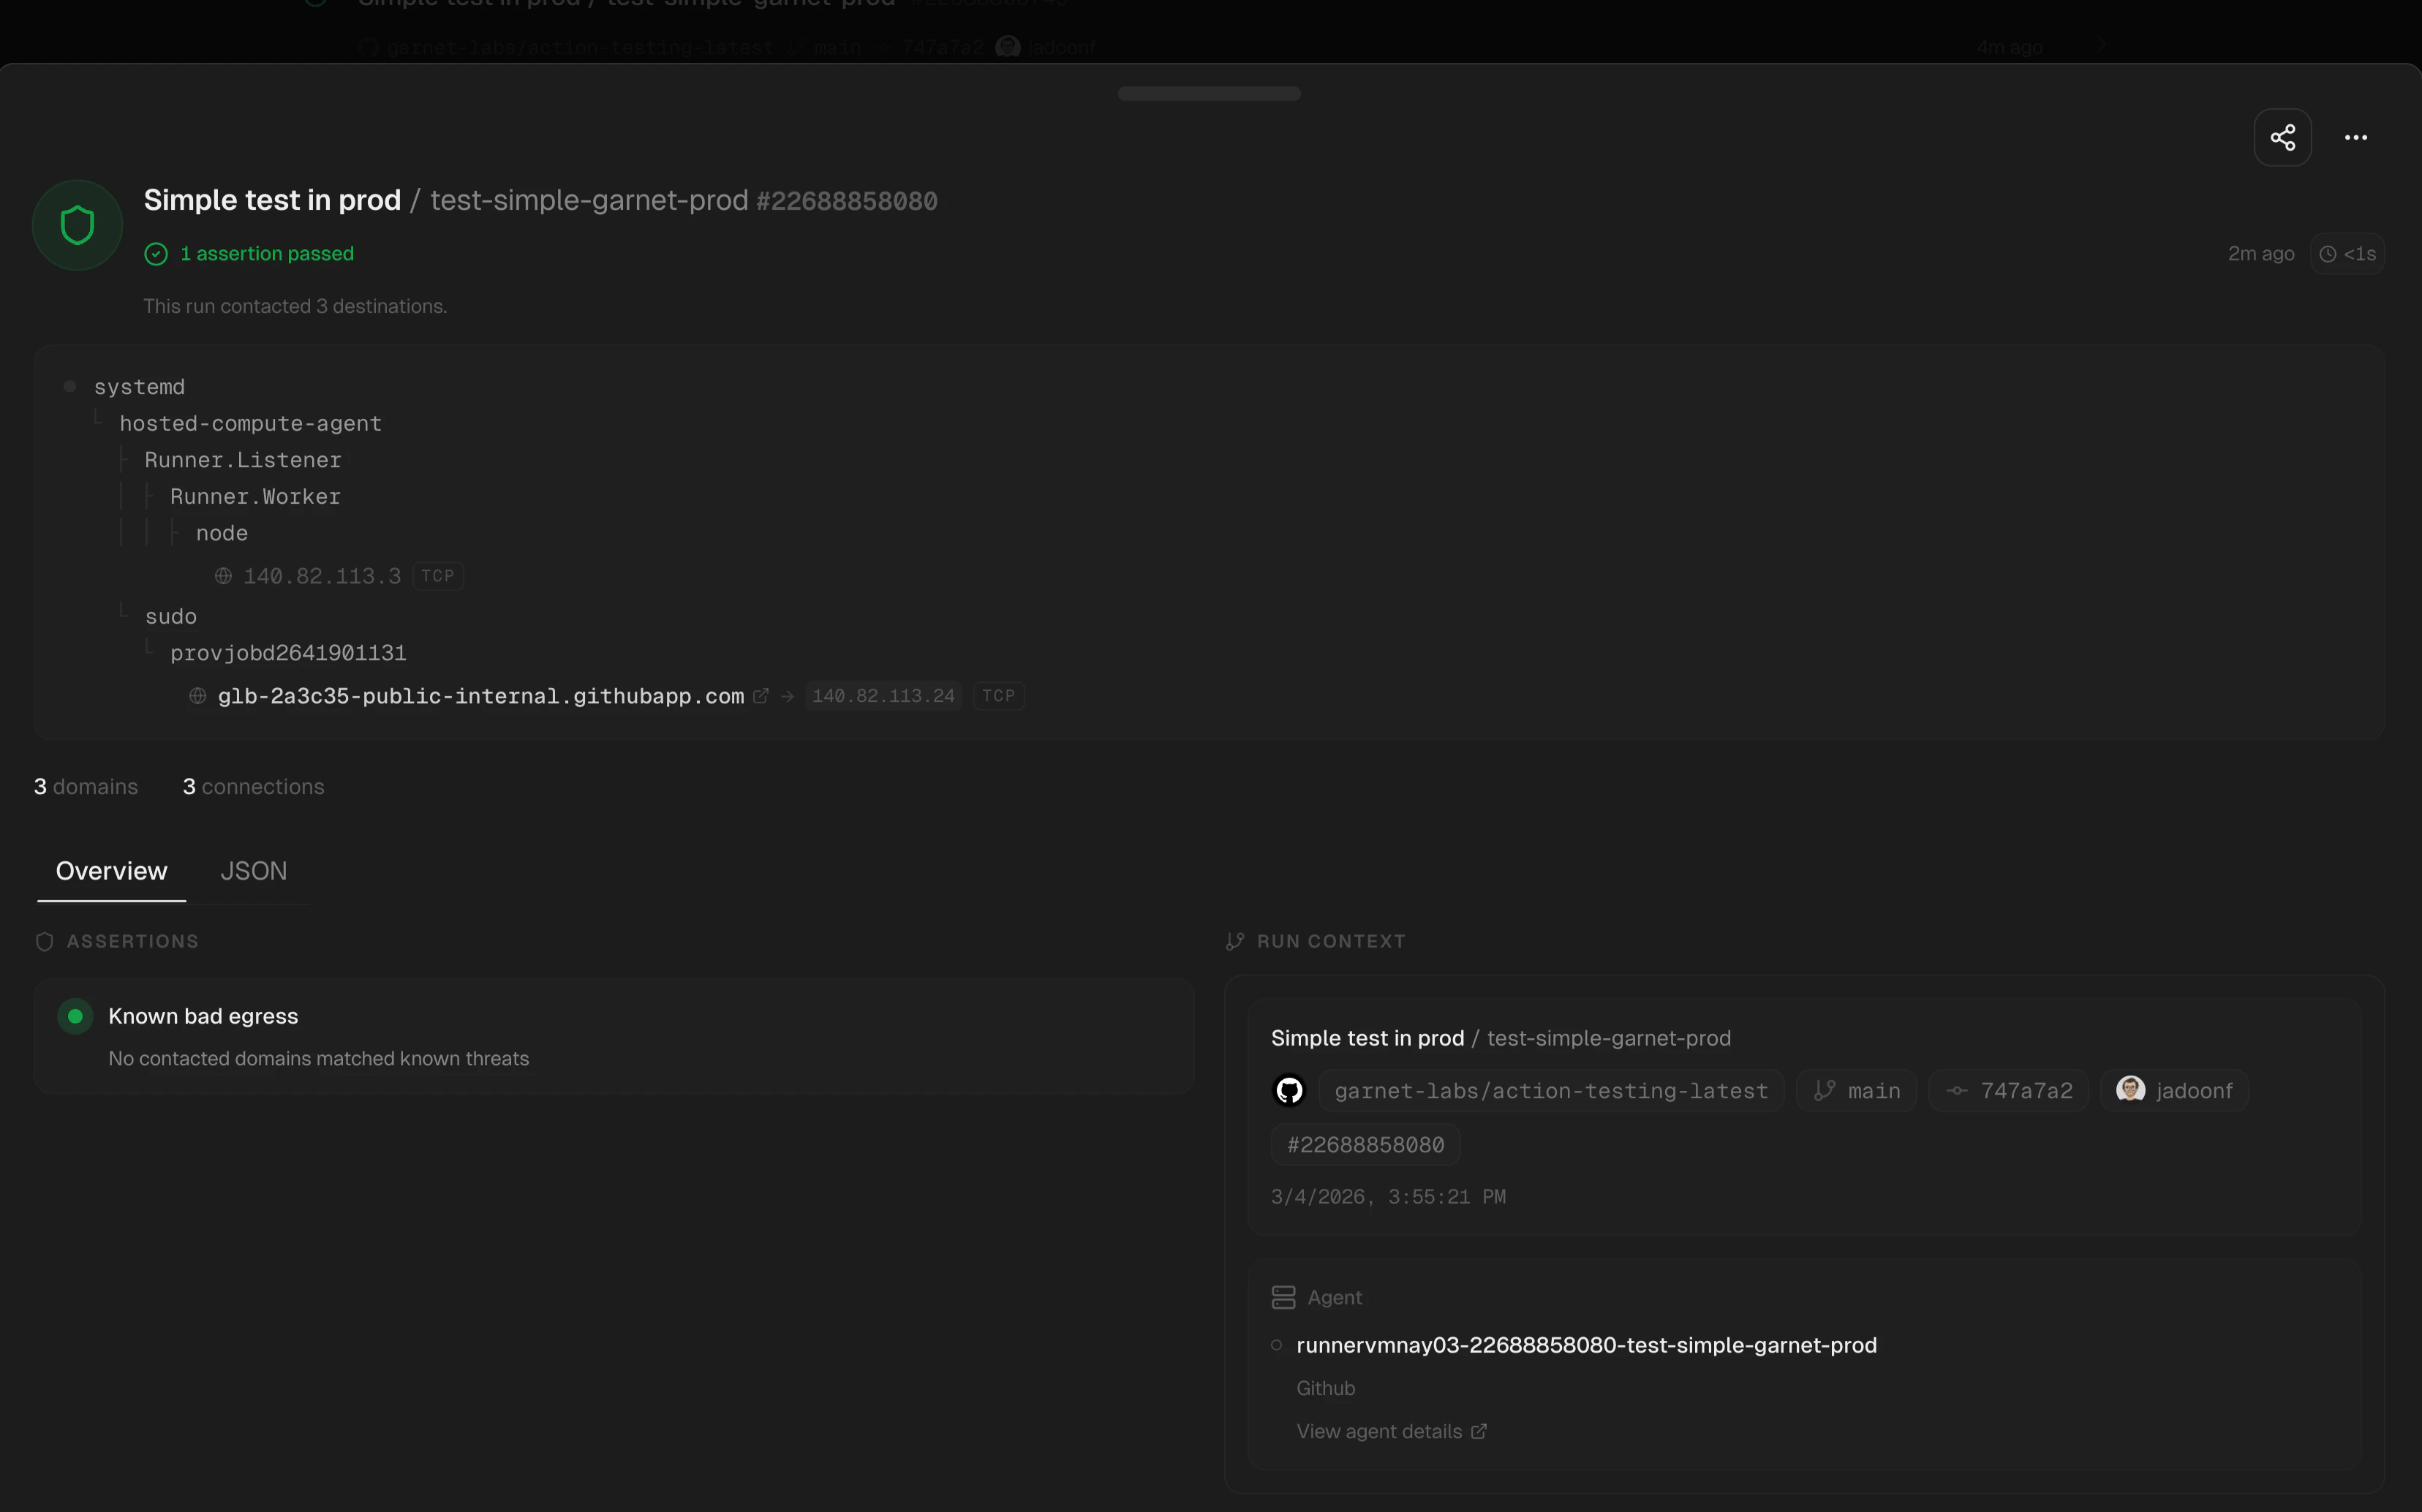
- Process tree — Full chain with connections inline
- Overview / JSON — Structured or raw data
- Checks — Green when no threats matched
- Run Context — Workflow, repo, branch, SHA, actor, agent
Run details — flagged
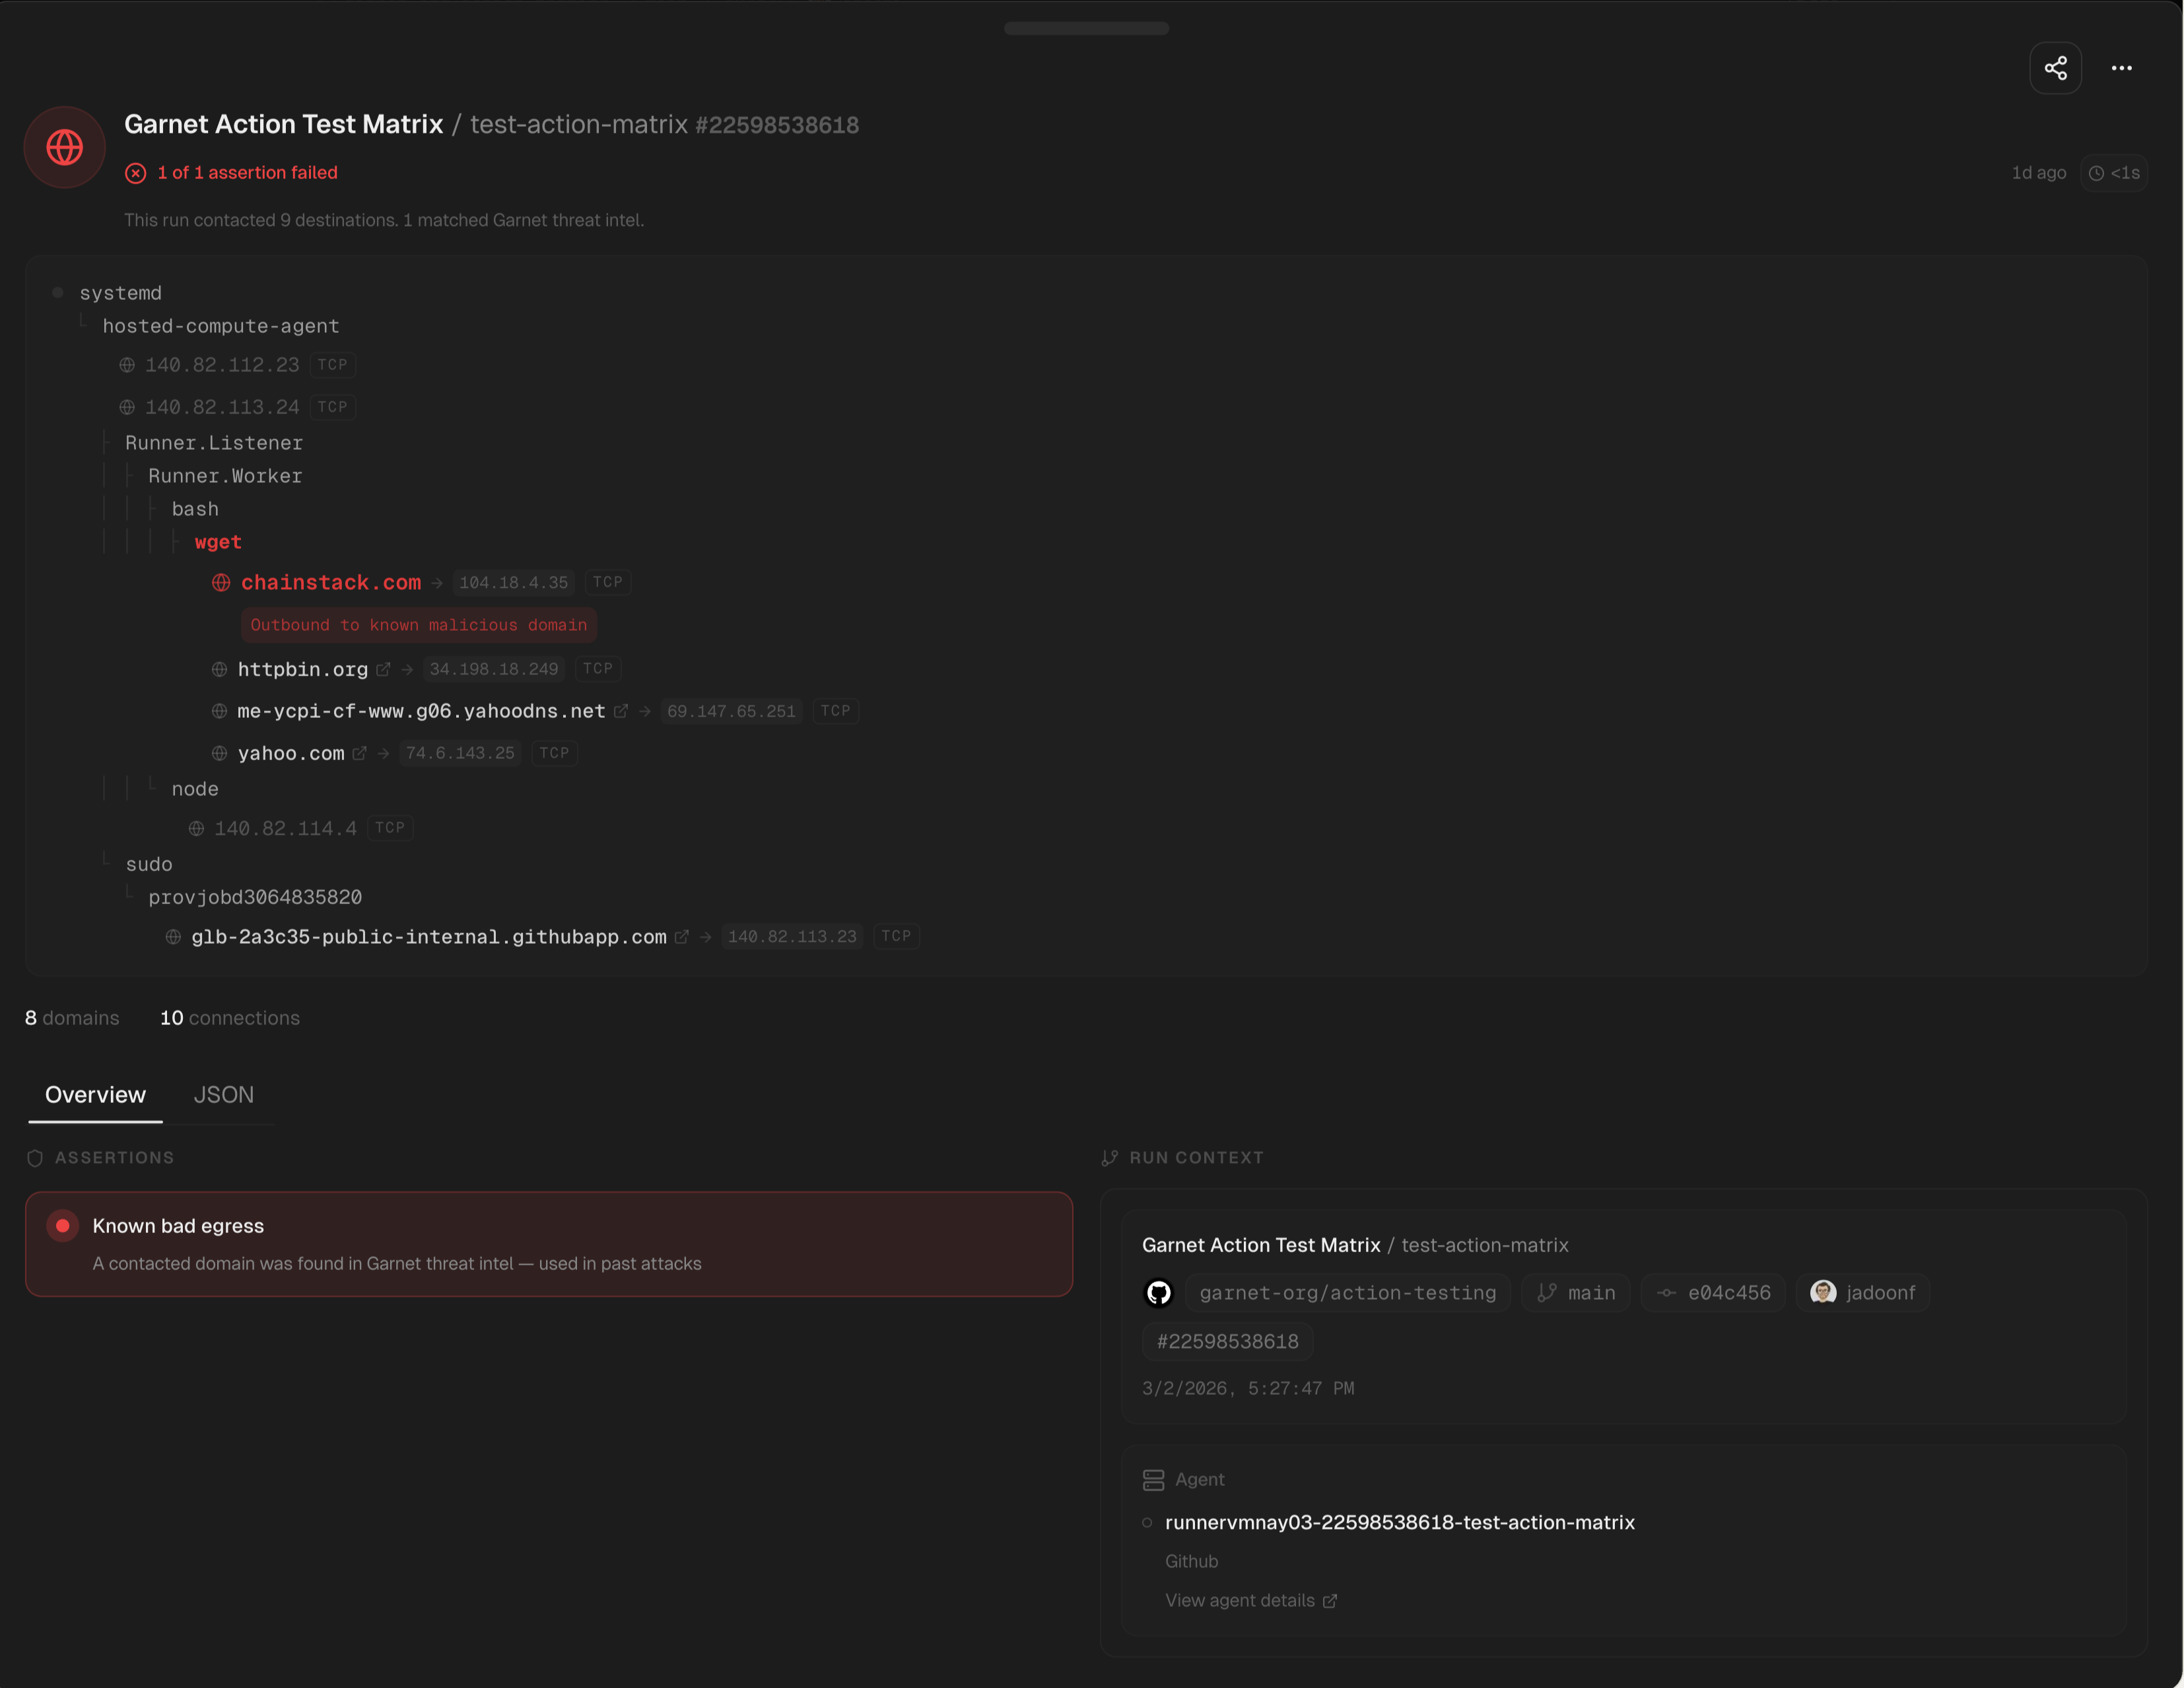
- Red connections — Suspicious destination highlighted in the tree
- Failed check — Red state with threat intel match detail and full process ancestry
- Same context metadata as passed runs