Events Dashboard
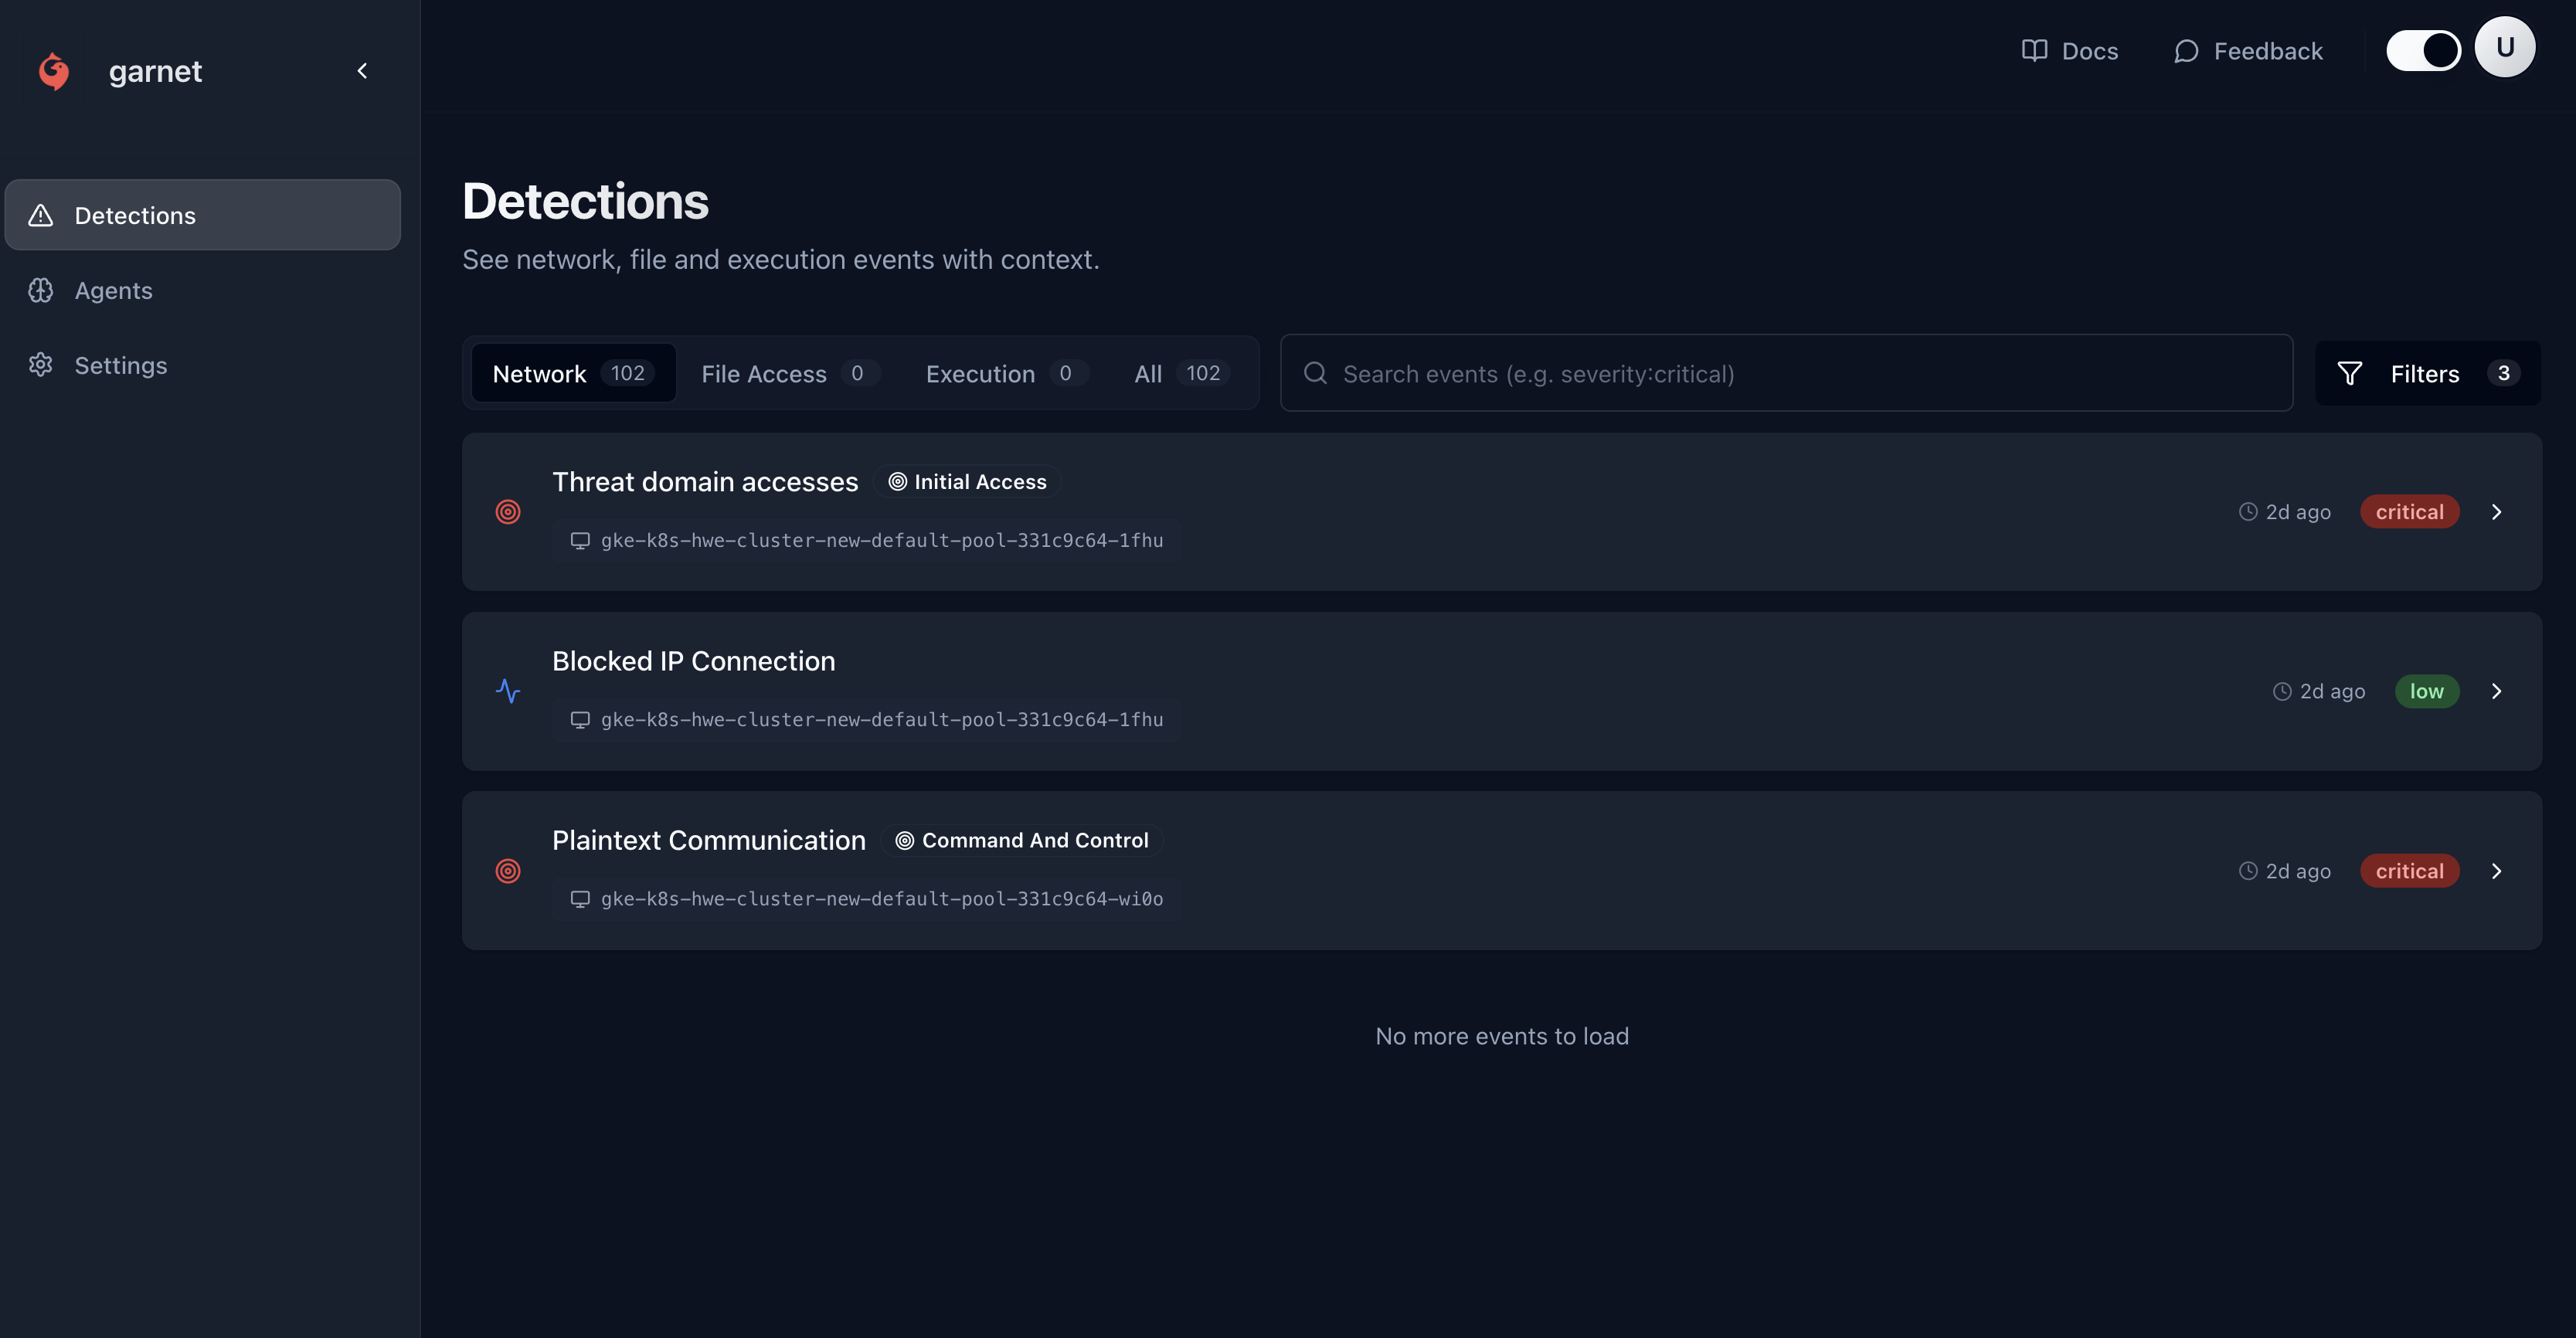
Event Types
Network Threats
- C2 communications
- Data exfiltration
- DNS tunneling
- Port scanning
Process Threats
- Crypto miners
- Malware execution
- Privilege escalation
- Code injection
File Threats
- Malicious downloads
- Unauthorized access
- File encryption
- Data destruction
Container Threats
- Container breakouts
- Image vulnerabilities
- Runtime modifications
- Resource abuse
Filtering Events
By Severity
- Critical
- High
- Medium
- Low
Immediate action required
- Crypto mining detected
- Active data exfiltration
- Container breakout attempts
- C2 communications
By Environment
Filter events by deployment environment:- GitHub Actions - CI/CD pipeline events
- Kubernetes - Cluster and pod events
- Docker - Container and host events
- All Environments - Combined view
By Time Range
- Last hour - Real-time monitoring
- Last 24 hours - Daily review
- Last 7 days - Weekly analysis
- Custom range - Specific time periods
Event Details
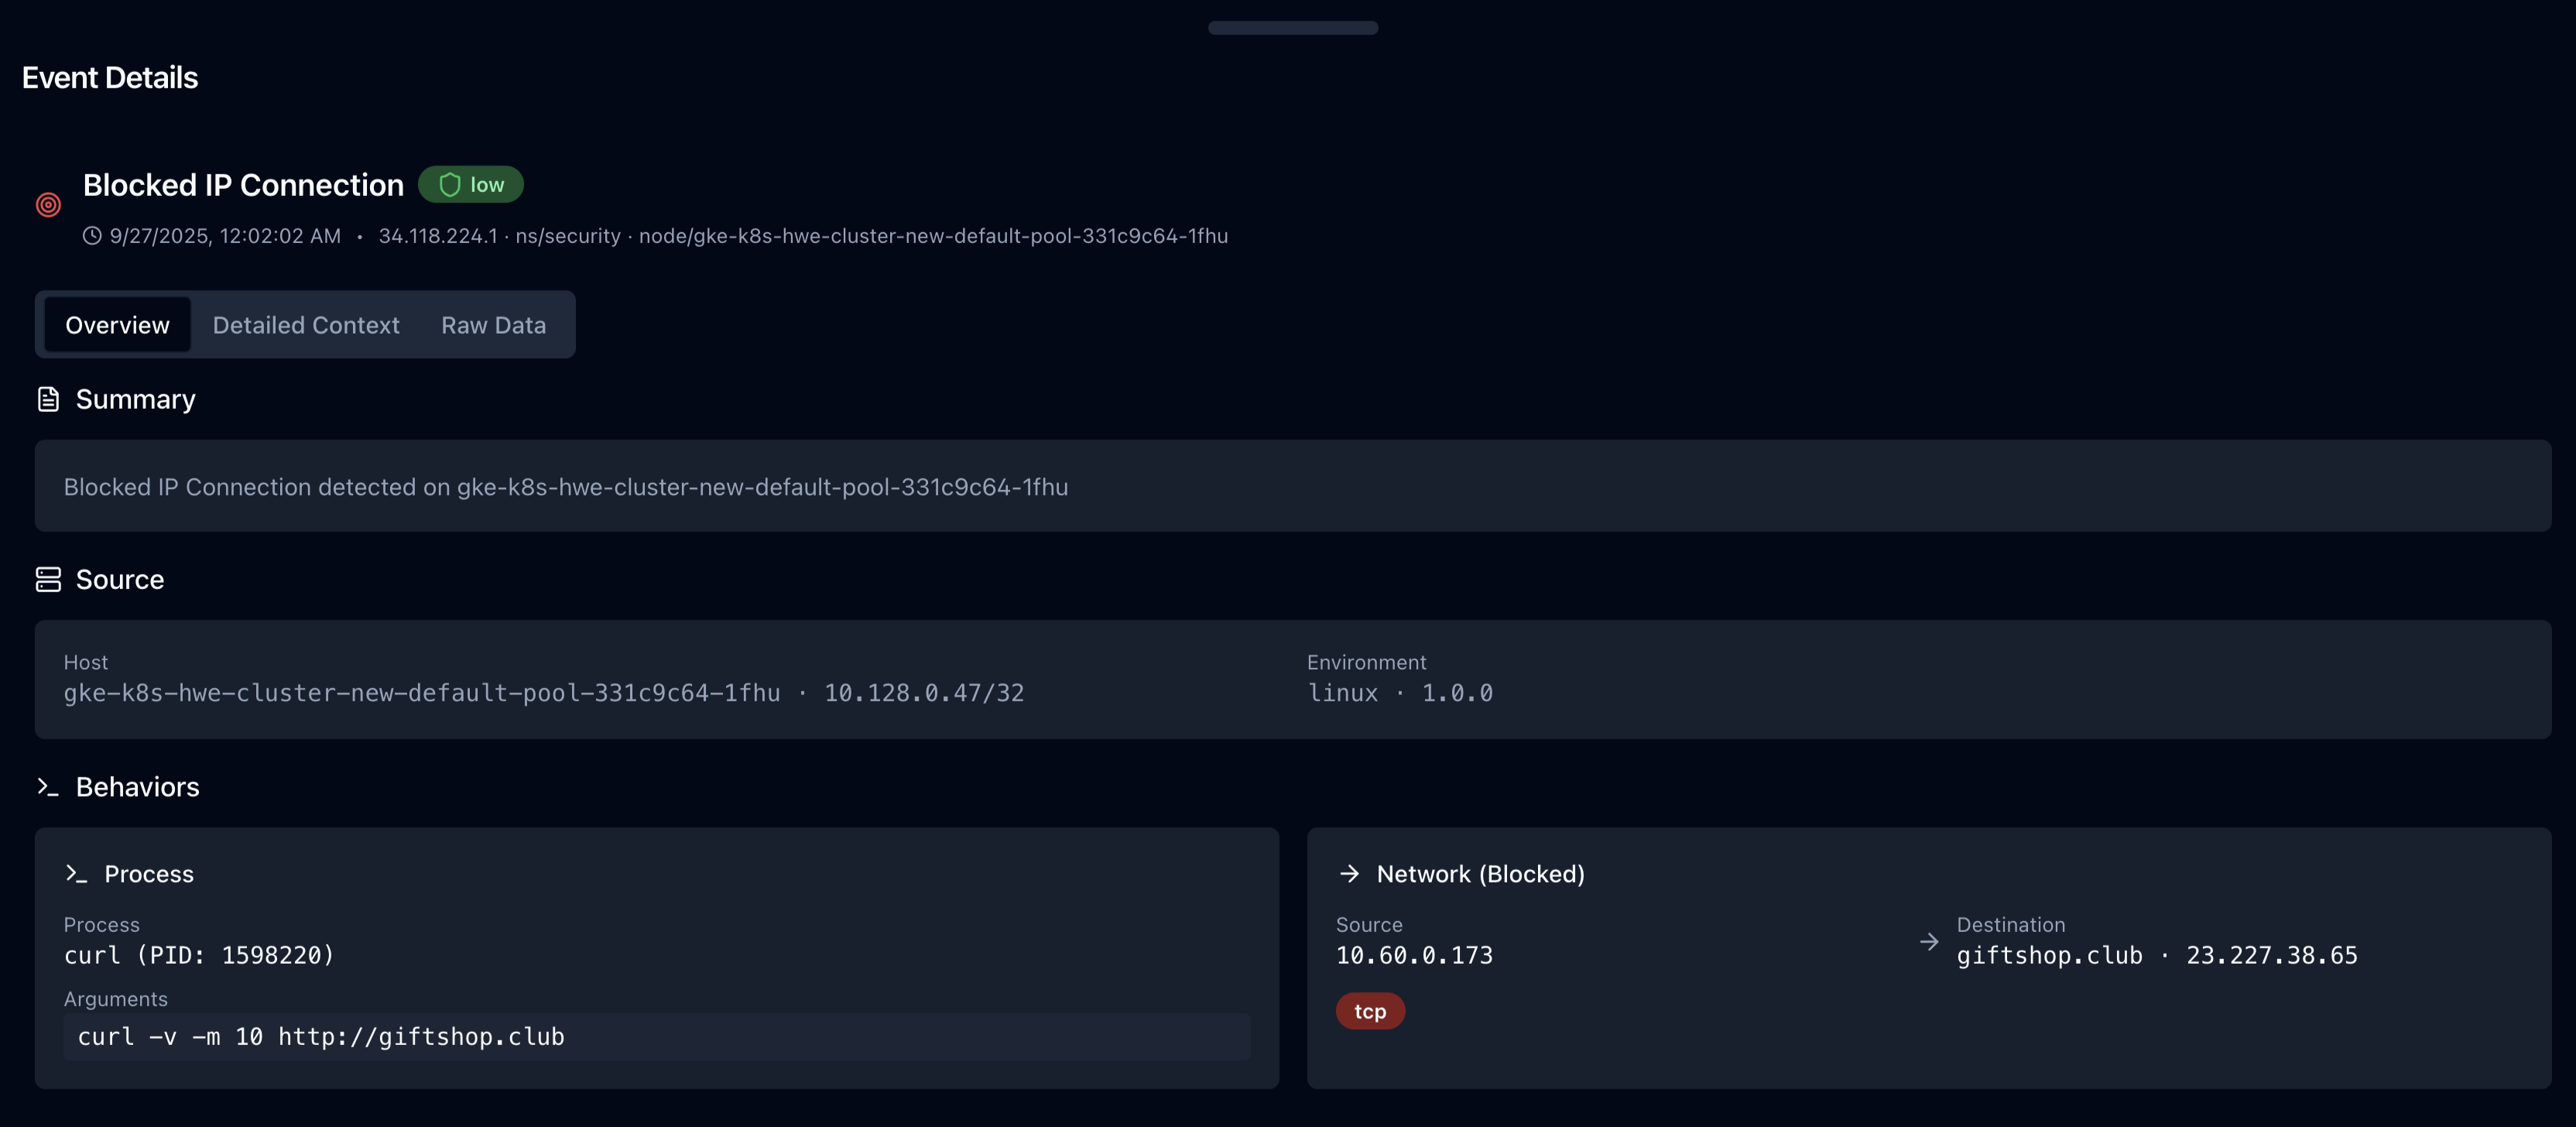
Core Information
- Timestamp - When the event occurred
- Agent - Which Jibril agent detected it
- Severity - Critical, High, Medium, Low
- Status - New, Investigating, Resolved, False Positive
Process Details
- Command - Full command line executed
- PID - Process identifier
- Parent - Parent process information
- User - User context
- Working Directory - Execution path
Network Details
- Source IP - Origin of connection
- Destination IP - Target of connection
- Port - Network port used
- Protocol - TCP, UDP, ICMP
- Bytes Transferred - Data volume
File Details
- Path - File system location
- Operation - Read, write, delete, execute
- Size - File size
- Hash - SHA256 fingerprint
- Permissions - File access rights
Taking Action
Mark as False Positive
If an event is legitimate:- Click “Mark as False Positive”
- Add optional comment explaining why
- Event is hidden from future views
- Similar events auto-marked as safe
Create Allowlist Rule
To prevent similar false positives:- Click “Create Allowlist Rule”
- Choose rule scope:
- Global - All environments
- Environment - Specific deployment
- Agent - Single agent only
- Define pattern to match
- Save rule
Block Network Destination
For network threats:- Click “Block Destination”
- Choose block scope:
- Global - All agents
- Cluster - Kubernetes cluster
- Agent - Single agent
- Confirm block action
- Traffic is immediately blocked
Export Event Data
For compliance or investigation:- Select events to export
- Choose format: JSON, CSV, PDF
- Include forensic details
- Download file
Event Analytics
Threat Trends
View threat patterns over time:- Volume - Number of events per day
- Types - Most common threat categories
- Sources - Top attacking IPs/domains
- Targets - Most targeted assets
Environment Comparison
Compare security posture across environments:- Event Frequency - Events per environment
- Severity Distribution - Risk levels
- Response Times - Time to resolution
- False Positive Rates - Detection accuracy
Agent Performance
Monitor agent effectiveness:- Detection Rate - Events per agent
- Coverage - Monitored vs total assets
- Health Status - Agent connectivity
- Resource Usage - CPU/memory impact
Automation
Webhooks
Send events to external systems:Slack Integration
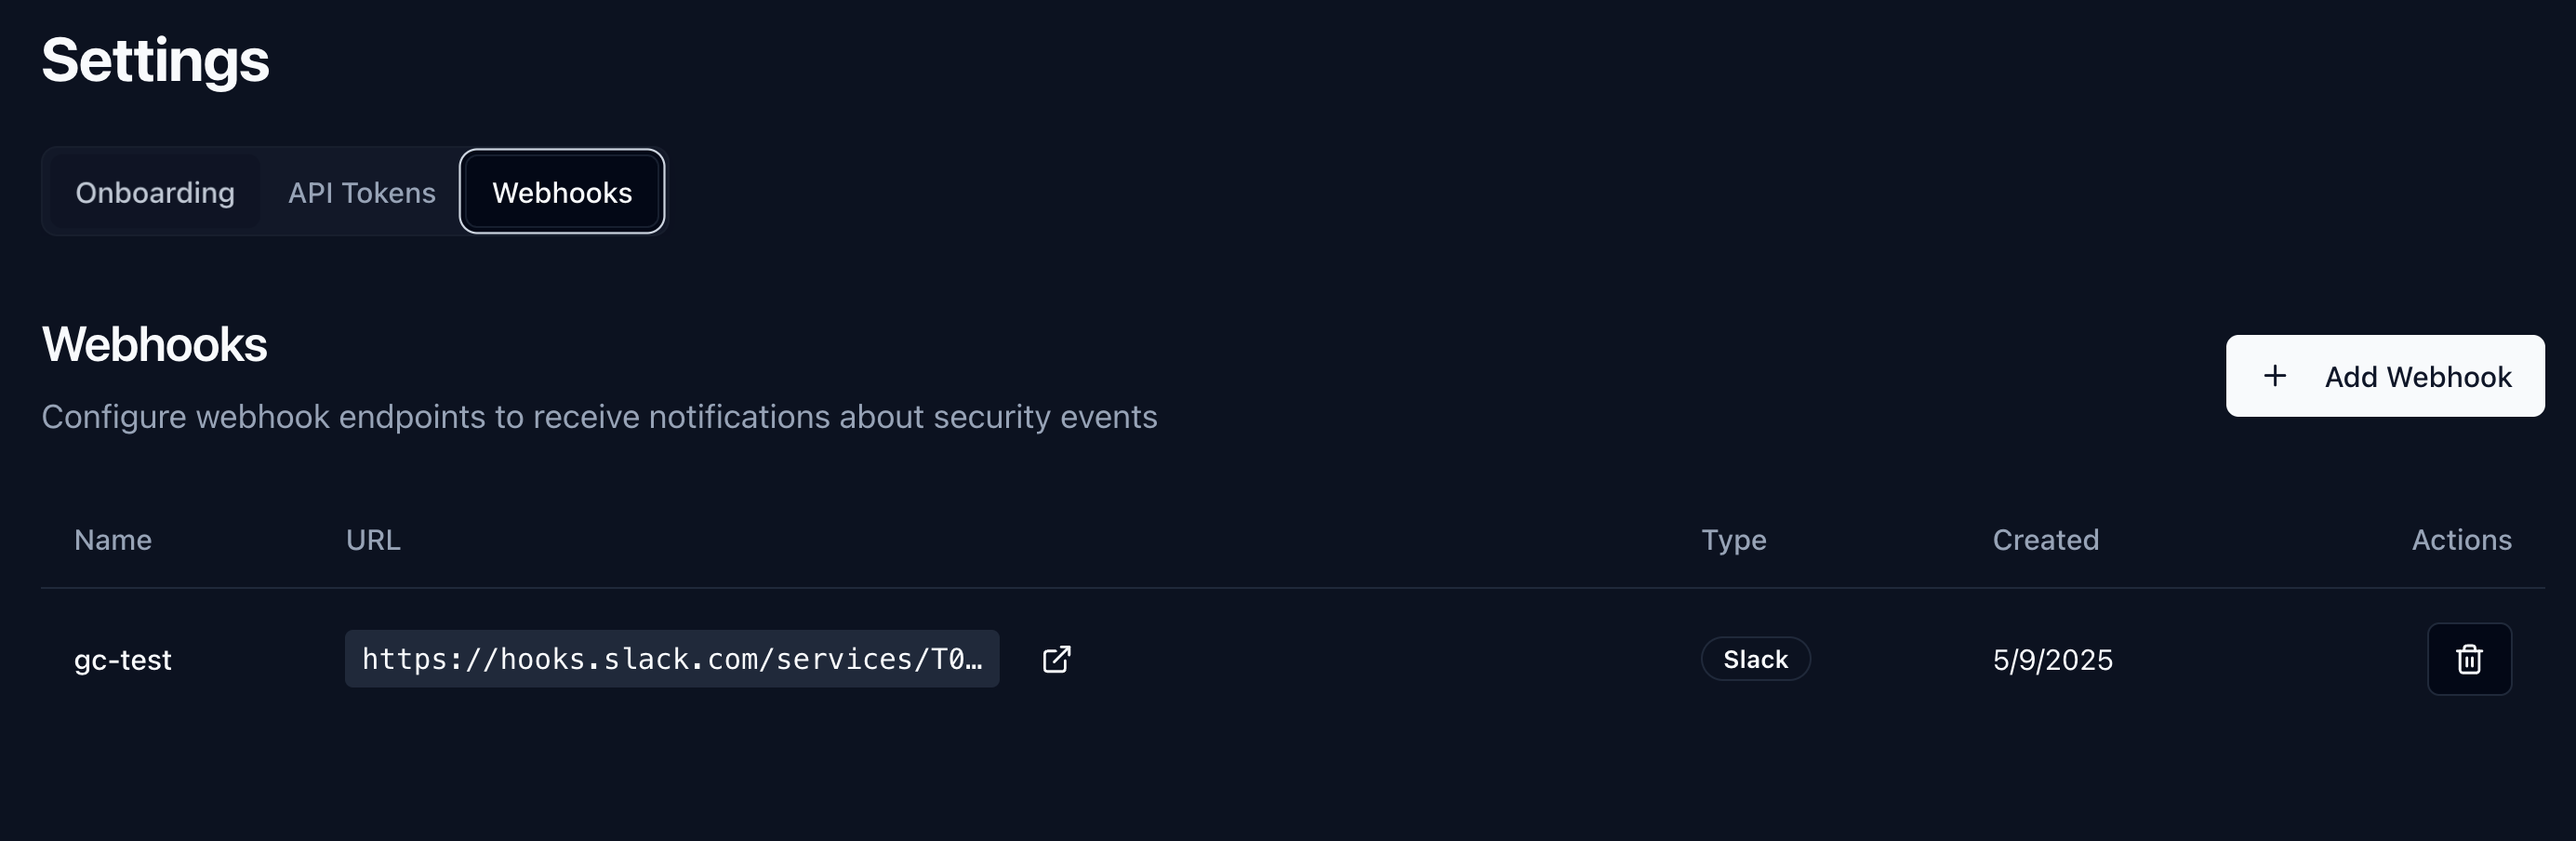
- Create Slack webhook
- Add webhook URL to Garnet dashboard
- Choose alert severity levels
- Test integration
SIEM Integration
Forward events to your SIEM:- Splunk - HTTP Event Collector
- Elasticsearch - Direct indexing
- Azure Sentinel - Log Analytics API
- AWS Security Hub - FindingsGenerator API
Best Practices
Daily Review
- Check critical events - Review all critical severity events
- Triage high events - Investigate high severity within 1 hour
- Update allowlists - Add legitimate activities to reduce noise
- Monitor trends - Look for unusual patterns
Weekly Analysis
- Review false positives - Adjust detection rules
- Analyze attack patterns - Identify recurring threats
- Update security policies - Strengthen weak areas
- Performance review - Optimize agent coverage
Incident Response
- Immediate containment - Block threats automatically where possible
- Investigation - Use forensic details to understand scope
- Remediation - Remove malware, patch vulnerabilities
- Lessons learned - Update policies and procedures
Troubleshooting
No events showing
No events showing
This might be normal if no threats are present.To verify detection is working:
- Run test command:
- Check agent status in Agents tab
- Verify agent connectivity
- Review detection sensitivity settings
Too many false positives
Too many false positives
High false positive rate affecting productivity.Solutions:
- Create allowlist rules for legitimate activities
- Adjust detection sensitivity in agent settings
- Use environment-specific rules
- Review and tune detection policies regularly
Events missing details
Events missing details
Some events show limited information.Causes and fixes:
- Agent version - Update to latest Jibril version
- Permissions - Ensure agent has sufficient privileges
- Network issues - Check connectivity to Garnet platform
- Rate limiting - Reduce event volume if overwhelming
Delayed event reporting
Delayed event reporting
Events appear minutes after they occur.Troubleshooting:
- Check network latency to Garnet platform
- Verify agent system clock synchronization
- Review agent resource usage (CPU/memory)
- Check for network filtering or proxies