Agents Overview
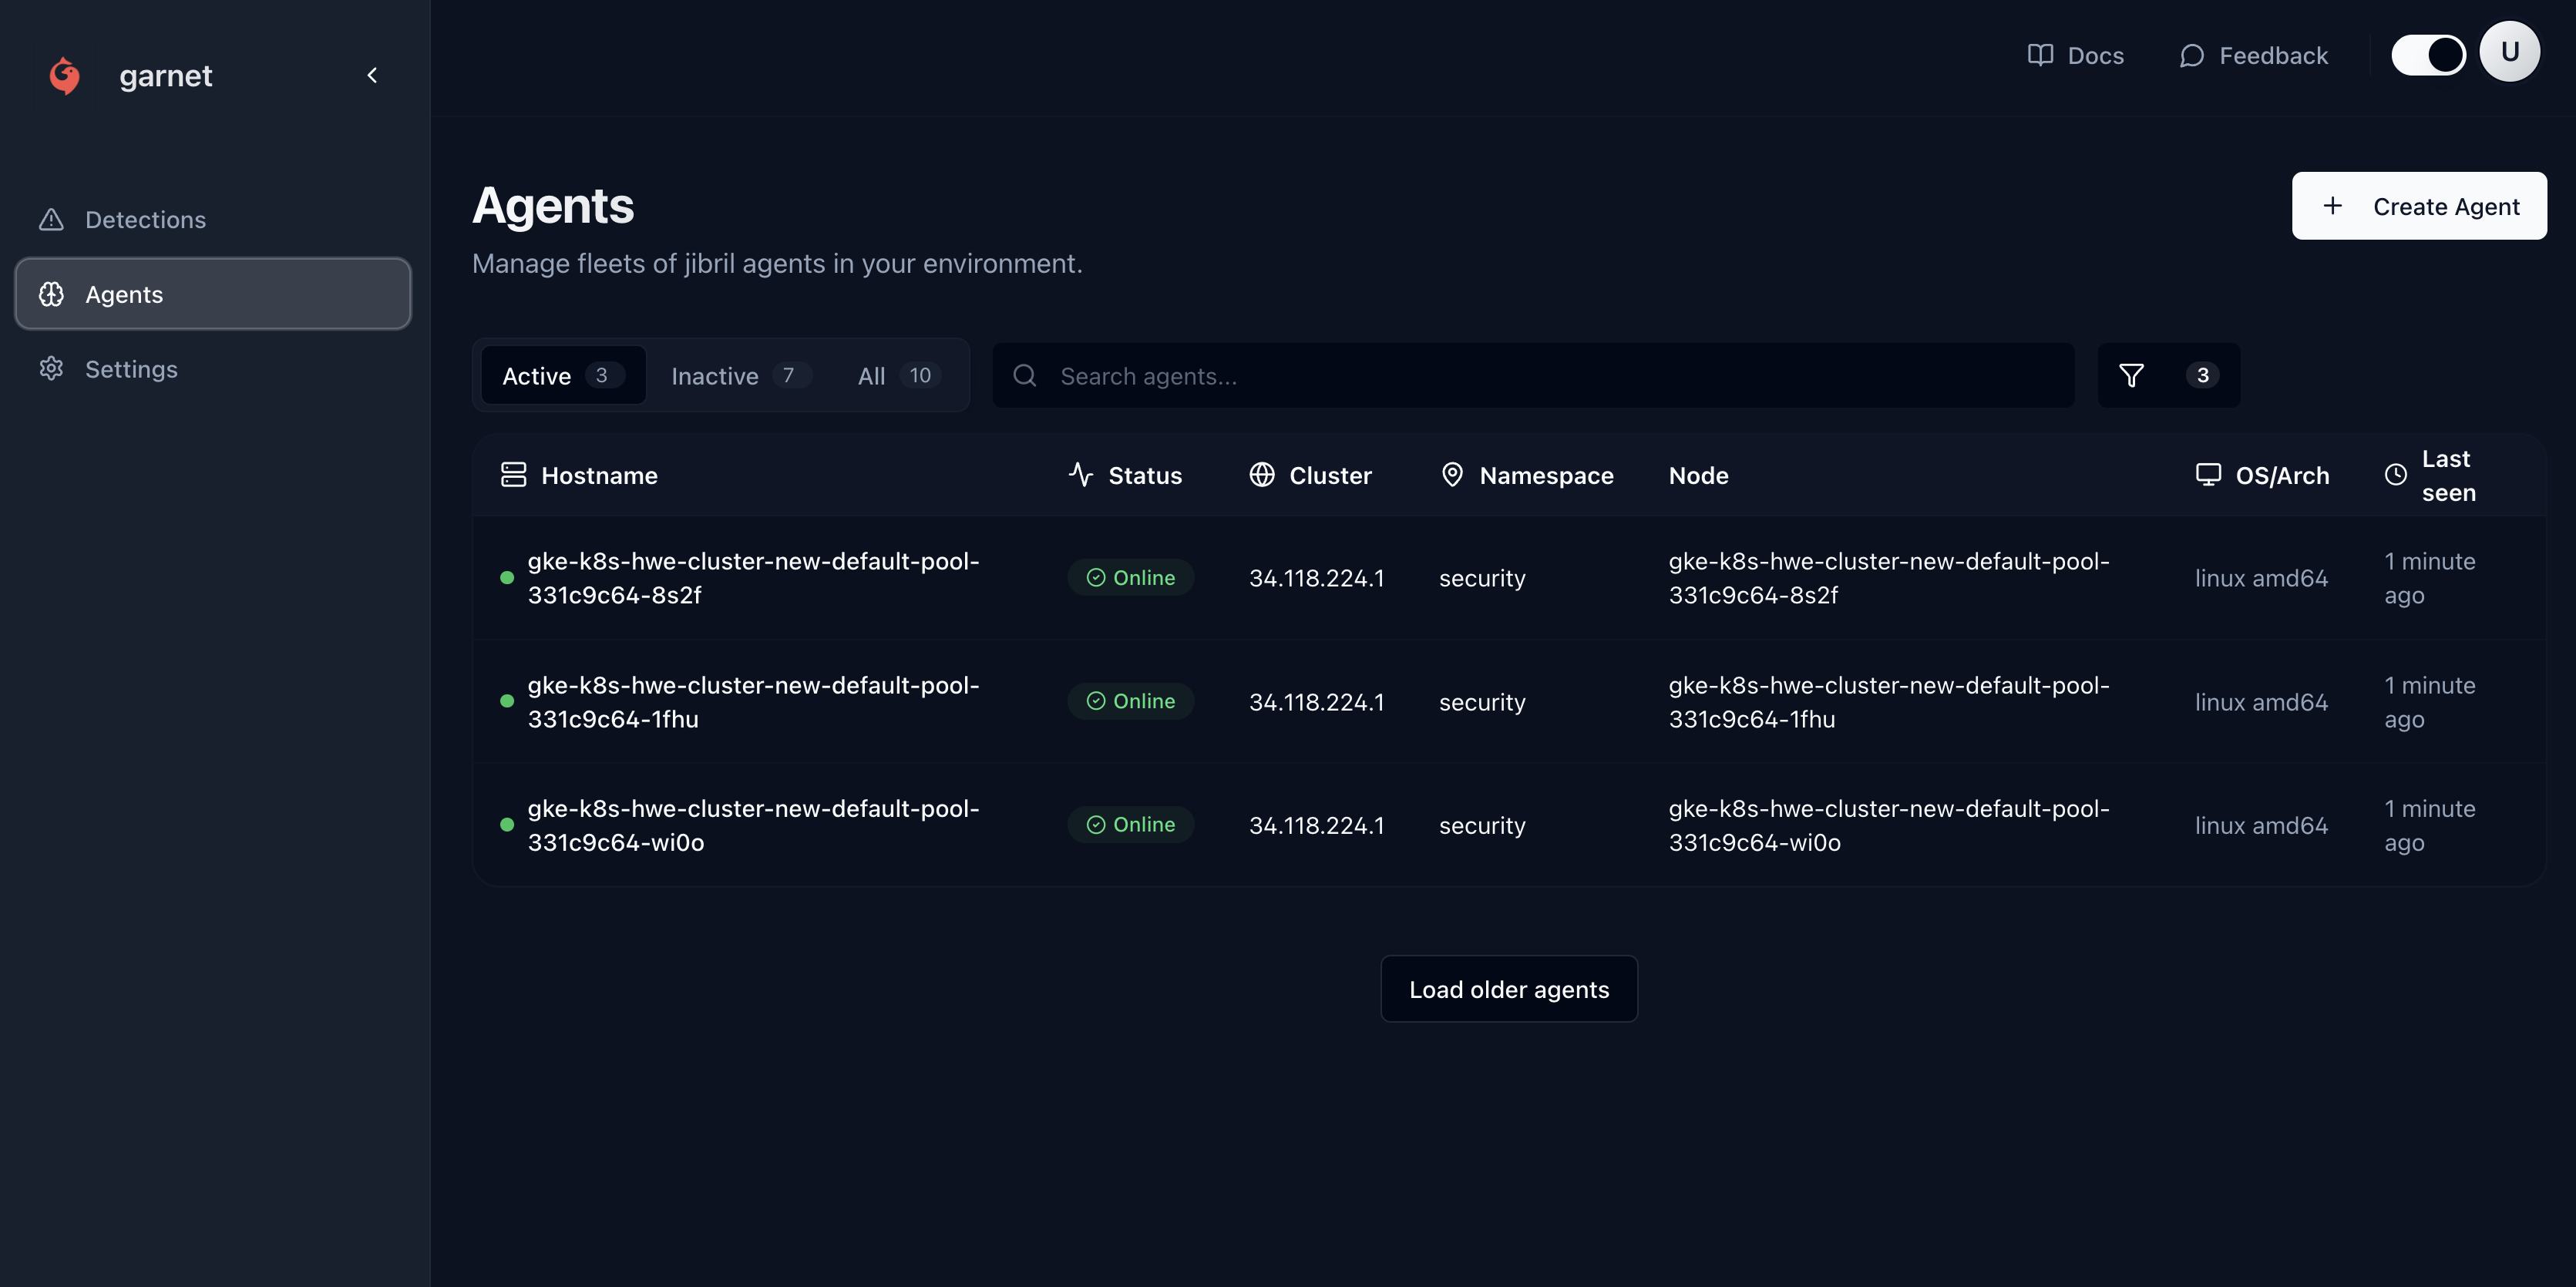
Agent Status
Health Indicators
Online
Healthy and reporting
- Last heartbeat < 60 seconds
- Actively monitoring
- Sending events normally
- All systems operational
Warning
Potential issues
- Last heartbeat 1-5 minutes
- High resource usage
- Network intermittency
- Configuration drift
Offline
Not responding
- No heartbeat > 5 minutes
- Agent crashed or stopped
- Network connectivity lost
- Host system issues
Error
Critical problems
- Authentication failures
- Corrupted configuration
- Insufficient permissions
- Platform incompatibility
Agent Information
System Details
Each agent displays:- Hostname - System identifier
- IP Address - Network location
- Operating System - Linux distribution and version
- Kernel Version - Required for eBPF compatibility
- Agent Version - Jibril software version
- Uptime - How long agent has been running
Resource Usage
Monitor agent performance impact:- CPU Usage - Percentage of CPU consumed
- Memory Usage - RAM utilized by agent
- Network Bandwidth - Data transfer to platform
- Disk I/O - File system operations
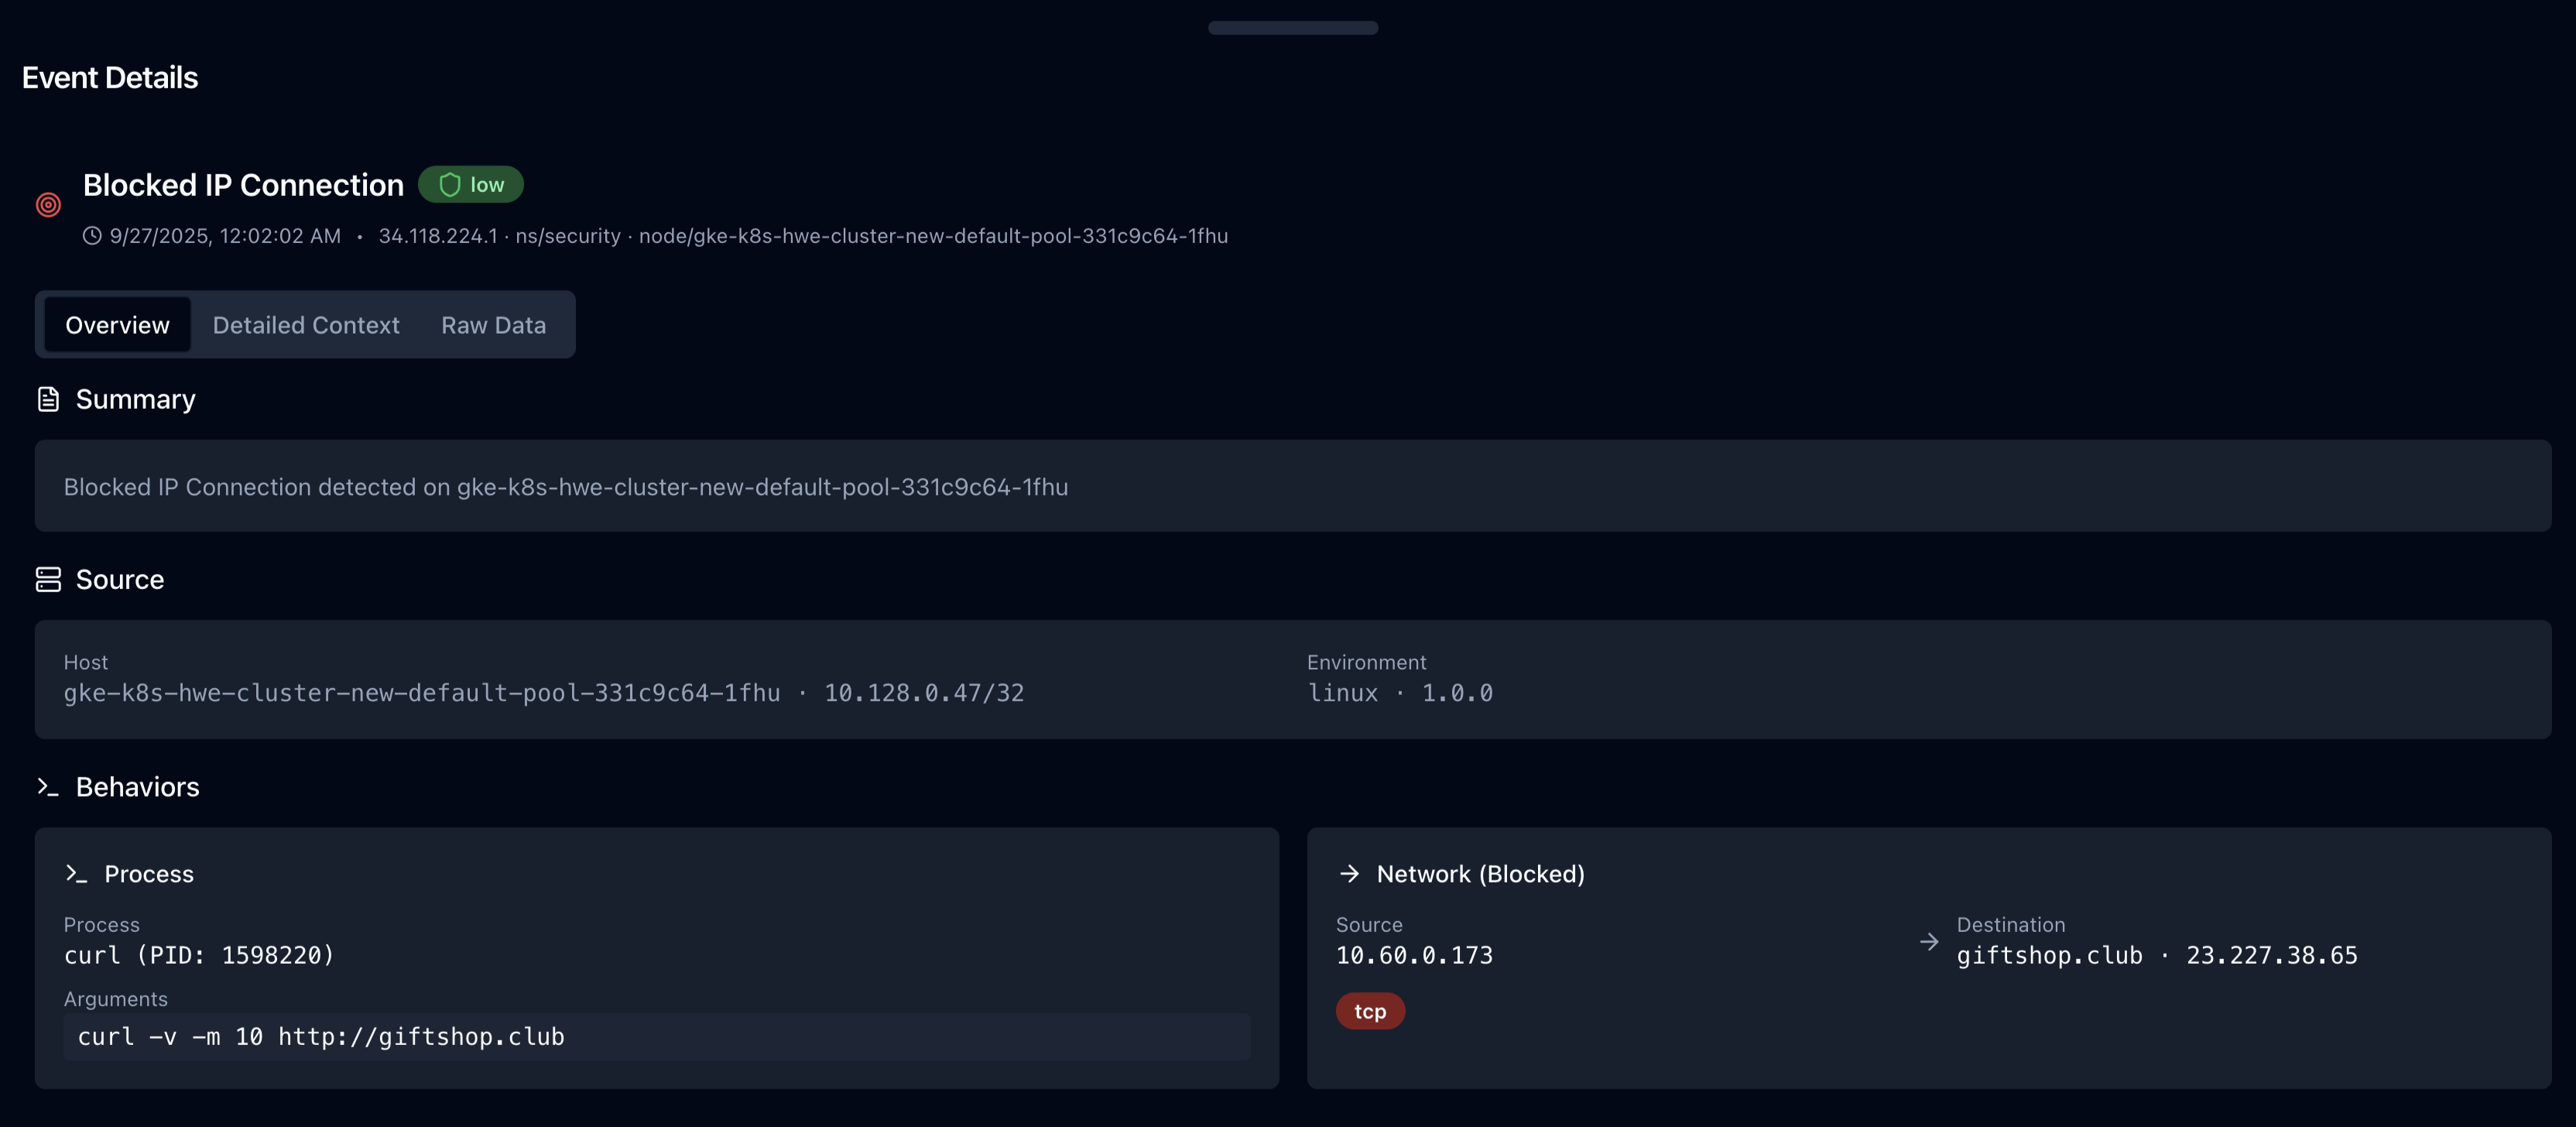
Detection Statistics
Track agent effectiveness:- Events Detected - Total security events found
- Events This Week - Recent activity
- Last Detection - Most recent threat found
- False Positive Rate - Accuracy metric
Agent Configuration
Detection Mode
- Monitor Only
- Active Protection
- Lightweight
Detection without action
- Logs all security events
- Sends alerts to dashboard
- No automatic blocking
- Good for: Testing, compliance
Sensitivity Settings
Adjust detection sensitivity:- High - Detect all suspicious activity (may increase false positives)
- Medium - Balanced detection (recommended for most environments)
- Low - Only obvious threats (may miss subtle attacks)
Environment Tagging
Tag agents by environment:- Production - Live production systems
- Staging - Pre-production testing
- Development - Developer environments
- CI/CD - Build and deployment pipelines
Agent Management
Bulk Operations
Perform actions on multiple agents:- Select agents using checkboxes
- Choose action from dropdown:
- Update configuration
- Restart agents
- Change detection mode
- Apply policy updates
- Confirm operation
- Monitor progress in real-time
Individual Agent Actions
For specific agents:View Details
View Details
Click any agent to see:
- Detailed system information
- Real-time resource metrics
- Recent security events
- Configuration history
- Performance graphs
Update Configuration
Update Configuration
Modify agent settings:
- Click agent name
- Go to “Configuration” tab
- Adjust settings as needed
- Click “Save Changes”
- Agent auto-updates within 60 seconds
Restart Agent
Restart Agent
If agent is unresponsive:
- Select agent
- Click “Actions” → “Restart”
- Confirm restart
- Wait 2-3 minutes for reconnection
Remove Agent
Remove Agent
To permanently remove:
- Select agent
- Click “Actions” → “Remove”
- Type agent name to confirm
- Agent stops monitoring immediately
Deployment Management
Add New Agents
Deploy agents to new systems:- GitHub Actions
- Kubernetes
- Docker
Mass Deployment
For large-scale deployments:- Prepare installation packages with pre-configured settings
- Use configuration management tools (Ansible, Chef, Puppet)
- Deploy via orchestration platforms (Kubernetes, Docker Swarm)
- Monitor deployment progress in real-time dashboard
Agent Updates
Keep agents current with latest security definitions:- Automatic updates - Agents self-update by default
- Staged rollouts - Test updates on subset first
- Manual control - Disable auto-updates if needed
- Rollback capability - Revert to previous version if issues
Monitoring and Alerts
Agent Health Monitoring
Set up alerts for agent issues:- Agent goes offline
- High resource usage
- Authentication failures
- Version outdated
- Configuration drift
Performance Monitoring
Track agent performance over time:- Response time trends - Latency to platform
- Resource usage patterns - CPU/memory over time
- Detection effectiveness - Threats found vs missed
- Error rates - Failed operations percentage
Capacity Planning
Monitor infrastructure capacity:- Total agents deployed - Current coverage
- Resource consumption - Aggregate usage
- Growth trends - Deployment velocity
- Scaling requirements - Future needs
Troubleshooting
Agent won't connect
Agent won't connect
Agent shows as offline despite being running.Troubleshooting steps:
- Check API token validity:
- Verify network connectivity:
- Check agent logs:
- Restart agent if needed
High resource usage
High resource usage
Agent consuming too much CPU or memory.Optimization steps:
- Switch to lightweight mode:
- Reduce monitoring scope:
- Limit resource usage:
Authentication errors
Authentication errors
Agent reports authentication failures.Resolution steps:
- Verify token hasn’t expired
- Check token permissions in dashboard
- Regenerate token if needed:
- Go to Dashboard → Settings → Tokens
- Create new token
- Update agent configuration
- Restart agent with new token
Configuration not applying
Configuration not applying
Changes in dashboard not reflected on agent.Troubleshooting:
- Check agent connectivity (must be online)
- Wait up to 60 seconds for sync
- Manually restart agent:
- Verify configuration in agent logs
Best Practices
Agent Deployment
- Use infrastructure as code - Terraform, CloudFormation, etc.
- Standardize configurations - Consistent settings across environments
- Tag appropriately - Clear environment and purpose labels
- Monitor coverage - Ensure all critical systems protected
Security Hardening
- Rotate tokens regularly - Update API tokens quarterly
- Use least privilege - Minimal required permissions only
- Secure network communications - TLS encryption enabled
- Monitor agent logs - Watch for suspicious behavior
Performance Optimization
- Right-size resources - Allocate appropriate CPU/memory
- Use lightweight mode - For non-critical environments
- Tune scan intervals - Balance security vs performance
- Exclude unnecessary paths - Reduce monitoring overhead
Operational Excellence
- Automate deployments - CI/CD integration
- Monitor health proactively - Set up alerts
- Plan for scaling - Capacity management
- Document configurations - Maintain deployment docs