

What’s recorded
One record, four surfaces. Jibril, an eBPF sensor, runs alongside your workflow and records network and process activity at the kernel — with full lineage and timing.Reading the comment
The comment records each action and the execution chain behind it.Execution Profiles recorded for 5 jobs, triggered by
Top to bottom:
6e5d0d425 execution chains · 12 destinations · recorded at the kernel by Garnet · 2026-07-13 23:54:31 UTC
▸
ci / docs-build ↗ · Run workload reached 1 destination▸
ci / install-only ↗ · Run workload reached 1 destinationsystemd
└─ hosted-compute-agent
├─ sudo
│ └─ provjobd
│ ├─ → localhost (dns resolver)
│ └─ → hosted-compute-watchdog-prod-iad-02[.]githubapp
└─ → 140.82.113.24View this job’s Execution Profile in Garnet →
▾
ci / workload-egress ↗ · Run workload reached 5 destinationsRunner.Worker
└─ bash
└─ node
├─ dash
│ └─ node
│ ├─ dash
│ │ └─ curl
│ │ └─ → httpbin[.]org
│ ├─ → registry.npmjs[.]org
│ ├─ → api.garnet[.]ai
│ └─ → github[.]com
└─ → registry.npmjs[.]org▸ dns + runner substrate · 6 chains
systemd
└─ hosted-compute-agent
   ├─ sudo
   │  └─ provjobd
   │     ├─ → localhost (dns resolver)
   │     └─ → hosted-compute-watchdog-prod-iad-02[.]githubapp
   └─ → 140.82.113.23
Runner.Worker
└─ bash
   └─ node
      ├─ dash
      │  └─ node
      │     ├─ dash
      │     │  └─ curl
      │     │     └─ → localhost (dns resolver)
      │     └─ → localhost (dns resolver)
      └─ → localhost (dns resolver)
View this job’s Execution Profile in Garnet →
A recorded comment, two folds open. workload-egress ran a workflow step that reached five destinations; lint recorded no step-attributed chain, so its row carries counts instead of a sentence.
- Headline — what was recorded, and the commit that triggered it.
- Metadata line — the run’s counts, kernel provenance, and recording time, one fact per
·segment. - One fold per job — headed
workflow / job ↗, linking to its Actions run. The rest of the row names which recorded steps reached how many destinations. - The tree — only processes with recorded egress. Destinations are
→ nameleaves under the process that opened them, defanged at the final dot. Resolver chatter and unattributed runner chains sit in the nesteddns + runner substratefold. - Per-job permalink — opens the job’s public run report.
The fine print — full comment contract
The fine print — full comment contract
- A job with no egress renders one quiet line:
no outbound destinations recorded.Before the first profile lands, the comment shows a waiting state (⏳) and fills in as jobs finish. - The
💡 How to read thisexplainer sits at the bottom, open on the first recorded result and collapsed on later updates. - Coverage is only N job(s) recorded on this commit — no expected-job denominator.
- Destinations are never compressed into
×N. A bare IP appears only when no remote name was recorded; secondary recorded names never create extra rows. - Large comments truncate deterministically and say so:
rendered X of Y destination associations— never silently. - The comment omits ports, protocol, and
[pid · process]suffixes. Those stay in the Garnet Execution Summary and the dashboard. - Display only: hostnames are defanged (
registry.npmjs[.]org), step names drop the runner’s ordinal prefix and any unexpanded${{ matrix.name }}expression, and process names drop a trailing run of four or more digits (provjobd1326539233→provjobd). The record keeps every raw value.
What changed since the last recorded commit
Once a pull request has two recorded commits, the comment stops being a snapshot and starts being a comparison against the previous profiled commit.![A Garnet comparison comment: the metadata line reads changed since 551aa3f, the job row leads with +1 −0, and the tree renders as a diff with one added destination, httpbin[.]org](https://mintcdn.com/garnetlabs/MtM7ocNSWoZe7QPB/images/comment-comparison.png?fit=max&auto=format&n=MtM7ocNSWoZe7QPB&q=85&s=3b2d3bede6133983605e90b59be46cb8)
![A Garnet comparison comment: the metadata line reads changed since 551aa3f, the job row leads with +1 −0, and the tree renders as a diff with one added destination, httpbin[.]org](https://mintcdn.com/garnetlabs/MtM7ocNSWoZe7QPB/images/comment-comparison-dark.png?fit=max&auto=format&n=MtM7ocNSWoZe7QPB&q=85&s=e74f776487d9c7f5a25daf2e233572b0)
A recorded comparison on the demo repository. The diff added one line — a postinstall hook. The run reached a host the diff never names.
- The metadata line carries
changed since <sha7>, linked to the commit it compared against — orno change since, when nothing moved. - The job row leads with the delta —
+1 −0— so the left edge is the scan column, and a changed job opens by default. - The tree becomes a diff, headed
@@ <head> vs <previous> @@.+is a destination or chain recorded now and not before,−is one recorded before and not now, unmarked lines are in both. A destination shows as both when its execution chain changed.
Attribution
The tree separates your workload from the machinery around it:Typography is the machine contract for attribution: workload lineage is bold (
<strong>), scaffolding is italic (<em>) — see Consume the Runtime Review. Attribution context, not trust.One comment per PR
One sticky comment, updated in place on every push and as each job’s profile lands, pinned to the head commit it records. The Action never fails your job — it records the run.What Garnet sees
The only secret Garnet uses is the API token you pass it. It never reads your other secrets, and never writes to your repo.- Metadata, not contents — an Execution Profile carries execution chains and outbound domains, IPs, ports, and protocols, not your source or your secrets.
- Observe-only — Jibril reads syscall-level events. Every eBPF program is checked by the kernel verifier before it loads and runs sandboxed.
- No pipeline changes — no sidecars, no proxies, no reordering of your steps.
Why sudo
Why sudo
Attaching eBPF programs requires sudo during install.
ubuntu-latest runners include it by default. Sudo loads the sensor — it doesn’t touch your build.The public run report
Every job’s permalink opens a permanent report page: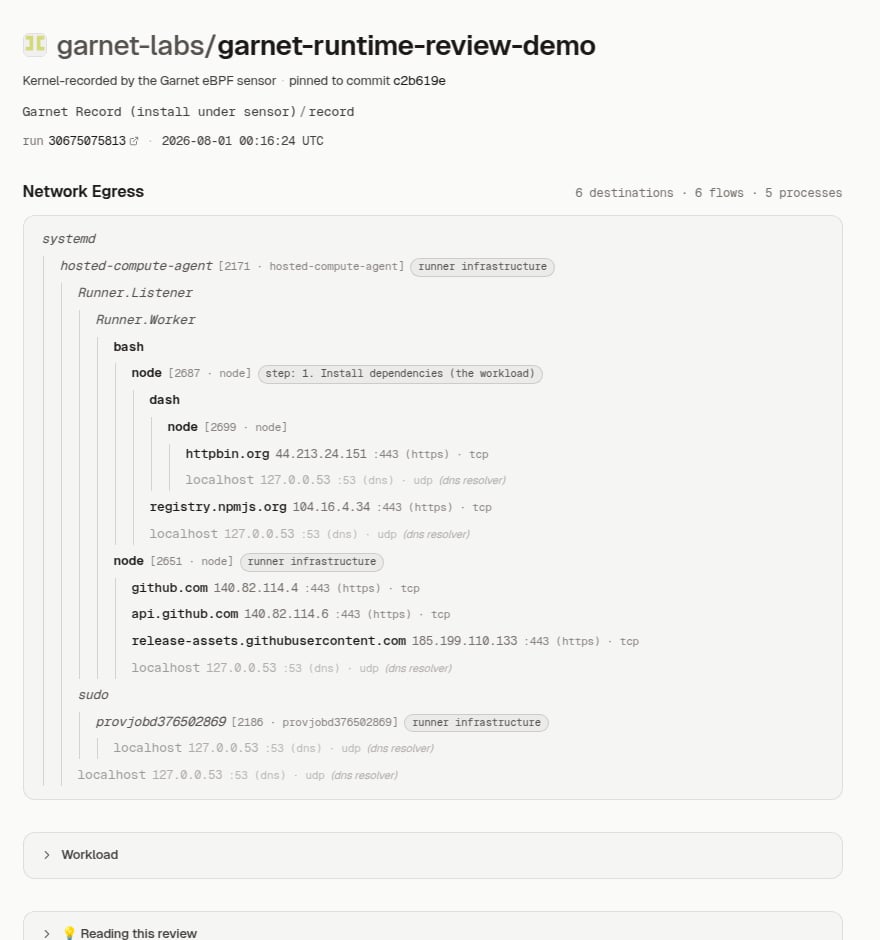
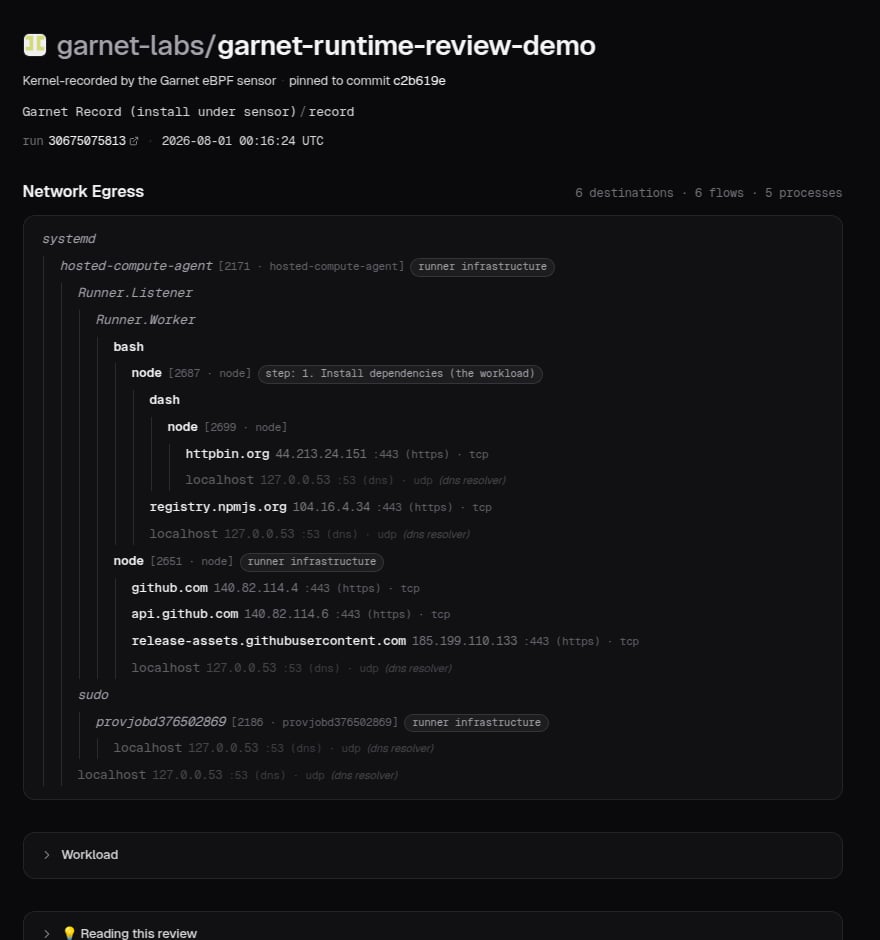
The report behind the comparison above — the same record with addresses, ports, protocols, and the step each destination belongs to.
?profile=<profile-id>is required and exact. Wrong or missing selector → 404, never a silent fallback. The comment and the Garnet Execution Summary carry it for you.- There is no run index. Bare
/public/runs/<run-id>— or a?job=query — is the same 404. - Private, revoked, unconsented, or no-longer-public records return the same 404. Publication needs explicit consent plus backend-confirmed public repo visibility, rechecked on every visit.
app.garnet.ai/api/public/runs/<run-id>?profile=<profile-id> — same selector rules. See Consume the Runtime Review.
README badge
A published Execution Profile can back a Garnet Runtime Profiled badge — it says the run was recorded, links to the report, and carries no verdict:?profile= is the same 404 as any other bare run URL.
Next: Consume the Runtime Review