

What’s recorded
One Execution Profile, four surfaces. Jibril, an eBPF sensor, runs alongside your workflow and records process and network activity at the kernel: the process paths that led to each outbound connection, with the workflow step attributed where the runner exposed one.Reading the comment
The comment records each action and the execution chain behind it. Everything below is one real comment, transcribed from a public source rather than drawn: the Runtime Review comment on garnet-labs/garnet-runtime-review-reference#29, contract6.10.0, recorded 2026-08-25 23:11 UTC at head 23bbd88. The Execution Profile its row links to opens without an account. The only transformation here is presentational: GitHub’s collapsed <details> fold is drawn open, and the comment’s HTML marker lines are omitted.
23bbd88
1 job unchanged · compared with 5a6561f
recorded at the kernel by Garnet · 2026-08-25 23:11 UTC
Garnet Record (install under sensor) / record ↗ · 12 destinationsView this job’s Execution Profile in Garnet →
One job, one fold, drawn open. The row’s 12 destinations counts the ○ leaves rendered beneath it. That is not the number of execution chains: this job’s record carries 17 of them, and the marker line the comment ships with — “chains”:17,“destinations”:12,“backgroundAdded”:4 — keeps the three measures apart. The workload half is unmarked because it did not move since 5a6561f; the runner’s own background did, by four, and says so at its root.
- Headline — what was recorded, and the commit that triggered it.
- Metadata line — the finding, then one quiet line for kernel provenance and recording time.
- One fold per job — headed
workflow / job ↗, linking to its Actions run, then that job’s destination count. Every job gets a row, and the rows sum to the metadata line. - The tree — one block per job, holding every recorded root, the runner’s own background included. Observed actions are
○leaves under the process that acted, defanged at the final dot. Brackets carry recorded context: the workflow step,(dns resolver),(github infra),(cloud metadata). - Per-job permalink — opens the job’s public run report.
The fine print — full comment contract
The fine print — full comment contract
- A job with no egress renders one quiet line:
no outbound destinations recorded.Before the first profile lands, the comment shows a waiting state (⏳) and fills in as jobs finish. - The
💡 How to read thisexplainer sits at the bottom, open on the first recorded result and collapsed on later updates. - Coverage is only N job(s) recorded on this commit — no expected-job denominator.
- Counts are adjacent to what they count and never interchangeable. A job row counts the
○leaves rendered under it; a boundary label likesystemd (runner background · +4)counts the additions in that subtree; the job’s total execution chains live in thegarnet:summarymarker and in the full profile, where the same comment reads"chains":17,"destinations":12. - Destinations are never compressed into
×N. A bare IP appears only when no remote name was recorded; secondary recorded names never create extra rows. - Nothing is dropped for brevity. Where GitHub’s comment size limit forces a cut, the comment states the surface it rendered —
rendered X of Y destination associations— rather than trimming silently. Within that limit the fold is what you inspect; the full set of recorded chains is in the profile itself. - The comment omits ports, protocol, and PIDs. All three are in the Execution Profile — the public run report and the dashboard.
- Display only: hostnames are defanged (
registry.npmjs[.]org), step names drop the runner’s ordinal prefix and any unexpanded${{ matrix.name }}expression, and process names drop a trailing run of four or more digits (provjobd1326539233→provjobd). The Execution Profile keeps every raw value.
What changed since the last recorded commit
Once a pull request has two recorded commits, the comment stops being a snapshot and starts being a comparison against the previous profiled commit. The comment above is already one:#29 had recorded 5a6561f before 23bbd88, which is why its tree is a diff and its metadata line reads 1 job unchanged · compared with 5a6561f.
Four things change in the comment:
- The metadata line names the movement and what it compared against —
1 job changed +5 destinations · 4 jobs unchanged · compared with <sha7>, or1 job unchanged · compared with <sha7>as above.+A −Rcounts destinations attributed to your workload; a zero side drops. - The job row leads with the delta when there is one, so the left edge is the scan column, and a changed job opens by default. An unchanged job carries its destination count and the word
unchanged, which claims the destinations only. - The tree becomes a diff, headed
@@ <previous> (previous) vs <head> (current) @@.+is only in the current record,−only in the previous one, unmarked lines are in both. - Runner background stays in place. It is never its own fold. A background root whose subtree moved carries the boundary label —
systemd (runner background · +2)— so the count sits beside the marks it counts, and image or pool churn never reads as a workload change.
Attribution
The tree separates your workload from the machinery around it, structurally:Bracket context
Bracket context
(…) is recorded or deterministically derived from the Execution Profile: (step: "Run workload"), (ran from /tmp/…), (dns resolver) — loopback on port 53, (cloud metadata) — 169.254.169.254, (github infra) — a name under .githubapp.com or .actions.githubusercontent.com, (github infra · rotated from …) — a provable address rotation inside GitHub’s published ranges, and (garnet sensor) — Garnet’s own upload. Everything else renders exactly as recorded, untagged.One comment per PR
One sticky comment, updated in place on every push and as each job’s profile lands, pinned to the head commit it records. Errors the action catches are logged as warnings rather than failing your job. The action records the run.What Garnet sees
GARNET_API_TOKEN is the only repository secret you provision on the token path; with GitHub OIDC (id-token: write, no api_token) there is none. The action also takes github_token, which GitHub supplies as ${{ github.token }} without you storing anything; it reads no other entry in secrets, and never writes to your repository.
- Metadata, not contents — the fields an Execution Profile is built from are execution chains and the destinations they reached: process names, the recorded step, the working directory, domains, IPs, ports, and protocols. It is not a copy of your source, your environment, or your files. Full field list: Security and permissions.
- Observe-only — Jibril reads kernel events rather than modifying them; its eBPF programs pass the kernel verifier before they load. The sensor is not only eBPF: it installs with
sudoand runs as a root systemd service alongside your job. - No pipeline changes — no sidecars, no proxies, no reordering of your steps. On any error the step logs a warning and the job continues.
Why sudo
Why sudo
sudo and the sensor runs as root. ubuntu-latest runners include sudo by default.The public run report
Every job’s permalink opens a stable report page for as long as the record stays published: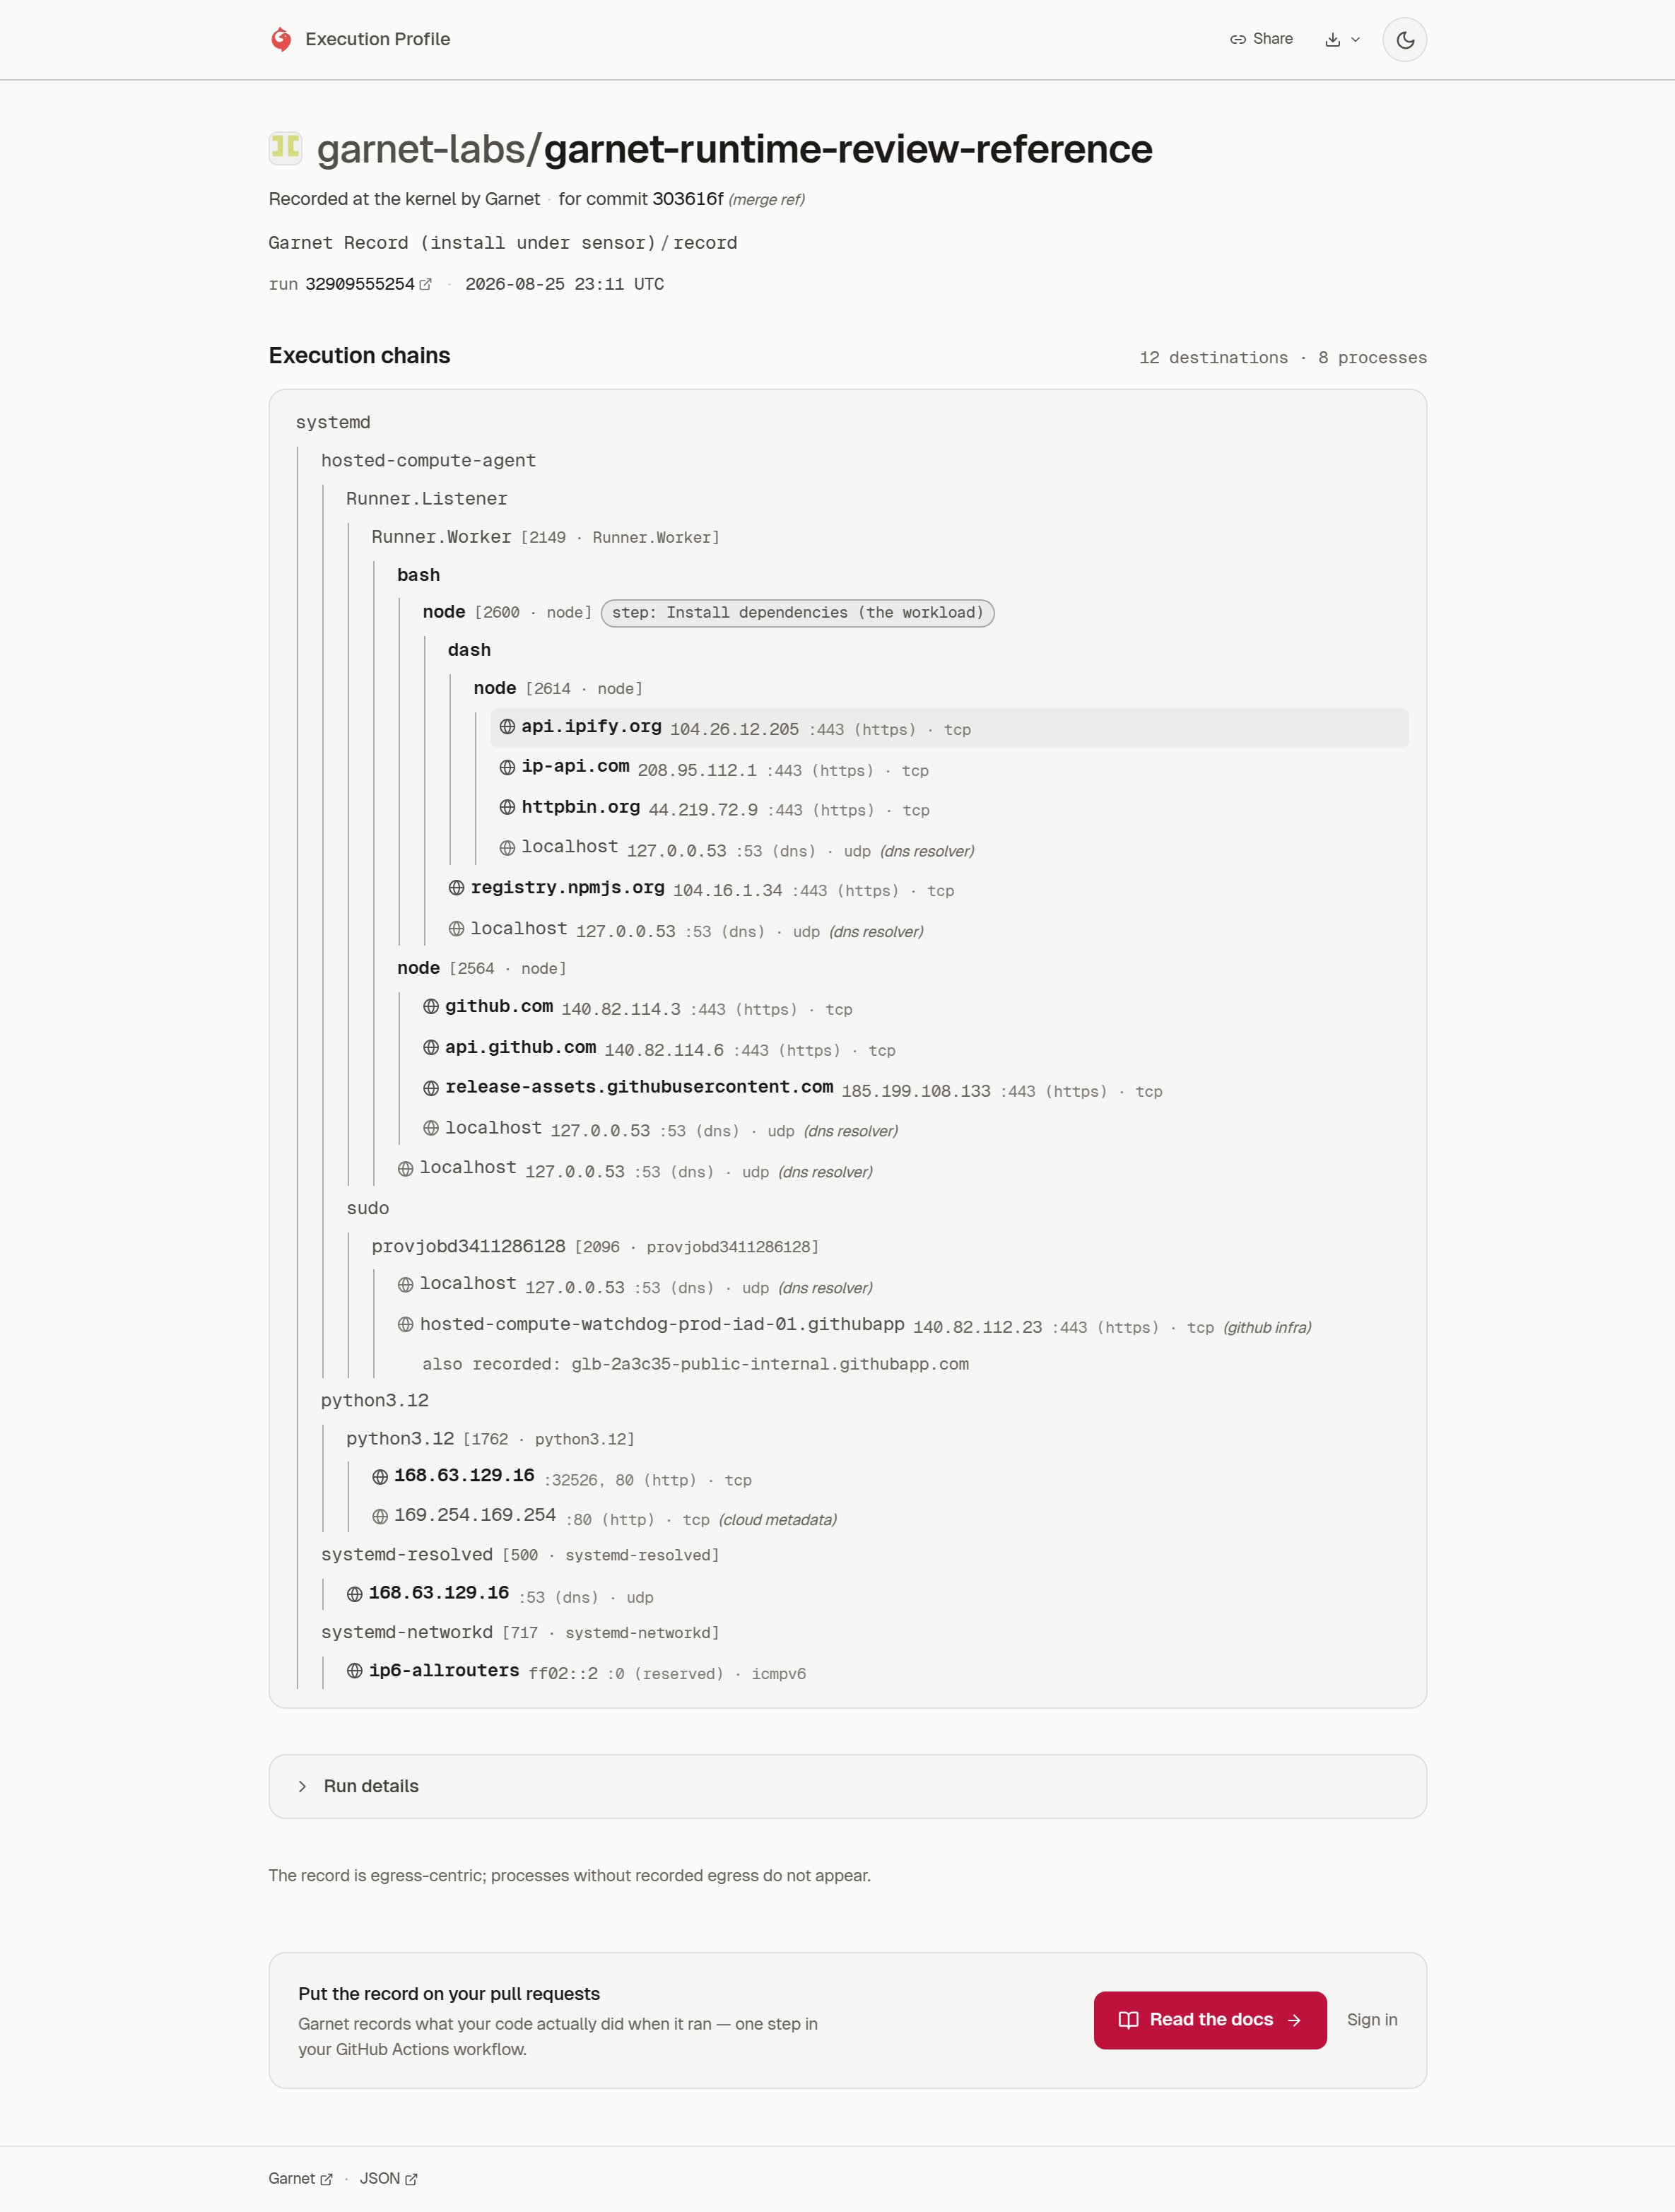
The report behind reference#29’s comment: the 12 destinations the comment renders, here with addresses, ports, protocols, PIDs, and the step each one belongs to. The record’s 17 execution chains are what those destinations were reached through — the two are different measures of the same job. Its header names 303616f, the merge ref the runner checked out; the comment binds the same run to head 23bbd88.
?profile=<profile-id>is required and exact. Only a published(run, profile)pair resolves; a wrong or missing selector is a 404, never a silent fallback. Use the published report’s permalink. The stable action’sreport_urloutput is a dashboard link, not this public URL.- There is no run index. Bare
/public/runs/<run-id>— or a?job=query — is the same 404. - A 404 is the same response whatever the reason, so it says nothing about whether a profile exists. What is verified here is the selector contract: a published
(run, profile)pair resolves anonymously, and a bare or wrong selector does not. Which records are published, and how publication is granted or withdrawn for a repository, is controlled in the Garnet dashboard, not by this URL shape. - The page’s canonical and
og:urlare the selector URL, and its copy-link button hands back that URL without theutm_campaign parameters.
app.garnet.ai/api/public/runs/<run-id>?profile=<profile-id>, same selector rules. It is the fuller of the two published views: the rendered comment leaves out fields the JSON carries, PIDs among them. Machine consumption is a preview; the supported path today ends at this report and the comment.
README badge
A published Execution Profile can back a Garnet Runtime Profiled badge — it says the run was recorded, links to the report, and carries no verdict:?profile= is the same 404 as any other bare run URL.
Next: Quick start · Consume the Runtime Review (preview)